As market and monitoring software evolve, deciding which of all network monitoring tools implement on your business becomes a difficult choice.
To help you choosing wisely, we have analyzed and compared the current best monitoring tools that solve your network monitoring requirements (both free and licensed).
Network monitoring tools in deep
Network monitoring is one of the most important sectors within all kinds of network tools. What we’ve done on this occasion is to use our experience with infrastructure monitoring tools to implement all of them for you to have the most complete analysis.
The objective is not to show that Pandora FMS is the best solution in network monitoring, but instead we mean to give a wide vision of all different solutions, so you can choose the best tool that adapts to your needs. Every installation is a world apart, and not all network tools are valid for every different environment.
Table of contents
- When to deploy a network monitoring tool?
- Network monitoring benefits
- Presales monitoring tool checklist
- Top 16 best monitoring tools & software review and comparison
Due to the success of the present article and the number of questions we have received, with queries about the different tools and softwares available and our criteria for choosing the right one for you, we have updated our analysis for you to have the most complete post.
When to deploy a network monitoring tool?
To ascertain whether this is the article you’re looking for, we’ll take a look at the conditions that determine if you need to install a network monitoring tool. Obviously, if you are already using network monitoring in your organization and just wish to upgrade the tool you use at the moment, you’ll know what we’re going to talk about here; just go ahead to the next section (network monitoring benefits).
For anyone else who is considering the topic for the first time, ask yourself:
- Does my organization depend on network availability?
- Is managing an ever-expanding IT infrastructure becoming overly time-consuming?
- Is the growth of network traffic in my infrastructure exposing bottlenecks? Is the network scaled to optimize all my resources?
If these questions sound familiar, this article will help you answering them.
Network monitoring benefits
If proper software is chosen, main benefit of a network monitoring system is reducing costs, by avoiding company downtime and unproductivity periods. Even if you’re not motivated by profit, any organization (ONG, healthcare, public transport services…) can equally benefit by reducing lost time and streamlining their infrastructure.
Network monitoring and IT monitoring allow you to optimize both processes and resources. By giving you a global perspective of your infrastructure, you can see which nodes are bearing the strain of traffic, where you might need extra hardware and where your system is not scaled correctly. You can see where data is clogging up your system, and why and also what to do to sort out the situation.
This kind of software not only provides a heads up on when a problem is coming down the pipe, but how to avoid said problem or stop it from turning into a headache.
With a solid monitoring tool and a proper implementation, you will be able to detect malicious traffic, where is coming from and how to cancel it.
Even though, you will be capable of generating time-stamped data logs, allowing the system administrator to build up a collection of historical data that is invaluable both for analyzing how problems have been solved in the past, how your network responded to previously-logged events and allowing for prediction of how your system will behave in the future.
Presales monitoring tool checklist
We know better than anyone, that choosing the right network monitoring tool within the wide range of options that are available is a hard and complex issue. Furthermore, choosing the wrong one would certainly mean loosing time and money. Here at Pandora FMS’ headquarters, we have performed many installations based on previous wrongly implemented software.
In order to avoid these kind of implementation errors, we have created a presales checklist that covers all main elements that must be taken into consideration before choosing a monitoring tool.
- Check that the software you’re interested in does not only monitor networks, but that it can also scale up in the case of a network expansion, with devices that includes apps, or hardware like servers, routers or switches. Making the right choice is the difference between growing smoothly, keeping everything under the oversight of a single tool, or incorporating more third-party software and losing the global, unified oversight a good network monitoring tool provides.
- Keep in mind the question of compatibility. Are the servers and applications you’re already running going to be compatible with the new network monitoring software?
- Be careful with licenses. Some companies take advantage of clients scaling up to introduce new licensing costs. Enquire about the cost of any additional licenses in the case of introducing new elements or components into your infrastructure.
- Your software configuration and its management is very important. Some monitoring tools involve complex, almost bespoke, configurations that later require a more costly level of competence on behalf of your system administrator, making them almost essential for your company. We have seen cases of companies changing their monitoring tool because their system admin has left.
- Ask your provider about their product’s scaling and performance capacities. Apart from the functional scalability already mentioned, network monitoring can also cover thousands of nodes and other elements under its aegis. In an interconnected world, businesses need to monitor other devices that are connected to its infrastructure, such as cell phones, vehicles or cash registers. In cases such as these is vital that your monitoring tool can provide monitoring to all these thousands of extra devices with maximum efficiency and performance.
- To incorporate all these inevitable extra devices find out if your chosen tool comes with an API capable of integrating with other applications.
- Alerts management. While it isn’t a problem managing alerts while you’re sat at the dashboard of your tool, what about when you’re not? Your chosen tool should be able to use multiple communication channels (email, SMS, messaging platforms) and them to be flexible enough to handle both the contents and the requirements of each platform.
- If you’re working with virtual systems it’s imperative that your network monitoring software is also able to monitor those as well. With the idea in mind of expanding your virtual systems, does your tool monitor all your virtual and also the virtual infrastructure itself? Ditto for containers.
- Do you need to inventory the components of your infrastructure and see them in a simplified way? Do you need to monitor offsite elements? If the answer is “Yes”, keep that in mind when you’re comparing softwares.
- Monitoring embedded systems is another point to consider if you’re monitoring hardware that doesn’t use conventional systems. In Pandora FMS, for example, we’ve monitored fleets of buses, allowing operators to know the status of each vehicle thanks to monitoring their mechanical hardware.
- Another aspect to bear in mind is generating and delivering reports. You need to show the status of the network to non-technical people, in a clear, exportable format, and directed at specific recipients who need different information. A one-size-fits-all is not acceptable here, which is why some monitoring solutions include customizable reports.
- Monitoring with agents or agentless monitoring? The age-old question of whether you need to deploy agents will depend on the nature of your IT environment. Sometimes it isn’t possible to deploy an agent, and sometimes it’s the best solution on offer. Will your chosen monitoring tool allow you to decide?
- Remote monitoring. If the networks to be monitored are geographically, or organizationally displaced, remote monitoring is your friend and ally. Keep disparate networks under observation from a central GUI.
- Cloud monitoring. If all, or part, of your infrastructure isn’t already in the Cloud, it will be sooner or later. Does your network monitoring tool allow for hybrid monitoring (your own CPD and Cloud installation), and to consolidate everything in the same dashboard?
- Saving and analyzing historic data is a crucial element of your network monitoring tool. It’s not only important to know what’s happening in real time but also to analyze past data, in order to make better informed decisions, and to modify your tool accordingly. Network monitoring is based on learning from historic metrics.
- Finally, the GUI. Is it adaptable to your current and future requirements? Will its functionalities scale up as your system does?
Note: all tendencies commented on this article are measured on a worldwide scale.
Top 16 best network monitoring tools compared
As we said at the beginning, we are going to analyze all the monitoring software you can obtain today for you and your organization. We will summarize each tool and its usage trend in order to analyze pros and cons of using them.
Finally, we will talk about Pandora FMS as a comperhensive monitoring solution. A tool that, if you would like to monitor more than 100 different devices with its Enterprise solution, you can try 30 days for free.
1. Nagios
Nagios is probably the best known free tool, and it comes to no surprise since they’ve been working in the U.S. since 1996 to build this monitoring software. Nagios’ core is the most important part of the tool and allows you to build plugins to monitor single elements.
It’s interesting to see how the demand tendency on the Internet has been diminishing with the passage of time. What before was one of the most potent and well-known network tools, is losing terrain.
It’s large-scale use is due to the fact that it was the first one to develop a tool that covered unexpendable characteristics in a network monitoring process. For this reason, Nagios was very popular. Furthermore, given its great initial market penetration, it’s still quite used.
You can find in depth comparison between Nagios, Zenoss, Cacti, Zabbix and Pandora FMS in these articles:
In a nutshell, Nagios was the origin for monitoring and, as a matter of fact, lots of new network monitoring tools have inherited the Nagios code and made it evolve. Even though you may have a lot of professional profiles on the market, these must have a very vast knowledge of the program, and your installation will depend on them 100%. Future migrations may also be complicated.
Open version: yes
Nagios PROS
- There are a lot of professional profiles with Nagios experience
- If there is a good knowledge of the tool involved, manual configuration can turn Nagios into a very powerful tool to monitor isolated or particular cases
- It has a large plugin offer to adapt the product to the user’s final needs
- Basic configuration is very easy
Nagios CONS
- Editing or configuration processes are difficult due to the necessity to make manual modifications in order to properly set up the tool
- The GUI lacks user-friendliness.
- Steep and costly learning curve
- Every installation ends up being a “puzzle” where rather than having a standard product, we finish with a personal appliance with hundreds of patches, self-made or third-party codes. All this apart from it being complicated to evolve or maintain by said third-parties.
- Simple reports
- Very lacking when it comes to SNMP, both in polling and trap management.
2. Zabbix
Developed by a Lithuanian company in 2005, Zabbix is known for being easy to configure and for having a very powerful GUI. It’s performance starts to decline when a large quantity of nodes is to be monitored. It’s agentless monitoring service stands out above the rest in its category.
Experience tells us you can monitor up to 10,000 nodes without performance issues.
We’ll show you the interest rate graph for Zabbix:
We’ve got the feeling that many Nagios users are moving over to Zabbix because it’s picked up on Nagios’ glove and it begins to have the visibility that Nagios used to have. The problem that we can see here is with its scaling on larger CPD’s. We have to tread carefully if our installation has various elements of the same type (for example databases) because their configurations will be complicated.
More in depth comparison here: Zabbix vs Nagios vs Pandora FMS.
Open version: Yes, Zabbix is an open software.
Zabbix PROS
- It has quite an active community
- At low levels, it’s still very strong and efficient.
Zabbix CONS
- Even though it has been used for large installations, starting at 1,000 nodes its performance can be diminished
- It’s difficult to create and define alert and report templates. Configurations can require many clicks and steps to be completed
- It doesn’t include real-time reporting
- Difficult to purge when there are errors
- Poor SNMP trap treatment
3. GroundWork
An American company that reuses different software elements from Nagios, Icinga or Cacti to create a global solution. It has managed to be among the top ranked network monitoring tools thanks to its mashup of other tools.
Our experience with GroundWork hasn’t been bad, but we’ve seen complications when integrating its different modules. Also, it doesn’t have many plugins developed. For larger environments it falls short. It doesn’t show an extensive history when we monitor a lot of nodes and it doesn’t support platforms such as HP-UX or FreeBSD. If you don’t possess a large CPD or lots of free time to tinker, we recommend checking it out since they have an interesting approach.
It’s search trend is, compared to others, residual and only focused on US market.
Open version: Yes.
GroundWork PROS
- Has a powerful Cloud monitoring: AWS, Azure, CLoudera, Docker, Google Cloud, NedI, NetApp, OpenStack o VMware.
GroundWork CONS
- Is not widely known
- Lack of user community
- Has not many plugins
4. Zenoss
Zenoss comes from an American enterprise that has created this software to monitor storage, networks, servers, applications, and virtual servers. It’s agentless monitoring is what makes it stand out. It has a “Community” version with very few features and a full-feature Commercial license.
Zenoss may seem interesting if you don’t really want to invest in monitoring software. If you don’t have that many machines and you don’t plan on investing in support or large features, then you can count on Zenoss as one of your network tools. Be careful though, Zenoss version 5 requires a very potent machine to run properly.
This is the internet trend that sees Zennos as a monitoring solution:
Open version: Yes, but it may just be too limited
Zenoss PROS
- All terrain regarding platforms. It’s capable of cross-platform monitoring
- It presents a very flexible and tweakable dashboard, which is quite powerful as well
- Great flexibility and potential in the event management offer.
Zenoss CONS
- Depending on the installation’s complexity and on what elements need to be monitored, adapting it can be a rough task
- The DataBase layer can get large and heavy in large environments.
- The panel can be slow on certain installations.
- It only has MySQL and its own database, lacking integration with other DataBase systems.
- Topology maps are one of the weakness of the product.
5. Monitis
Focused toward small or medium-sized companies. It’s for them that this can arise as a great network tool, and for this reason we’re counting it among the 15 best network monitoring tools.
If you’re a small company, this may be the tool that best suits you. We do recommend you use the fully licensed version, since the free one is kind of basic and can be easily rendered useless unless you’re running a blog or similar webpage. If you’re a small company, this may be the tool you need.
This has been the trend evolution of Monitis monitoring tool:
Open version: There really is none. Although, they do offer their monitor.us version, but its features are really basic and recommended for simple websites or blogs.
Monitis PROS
- Includes web transaction monitoring
- Allows the user to monitor common cloud applications such as Amazon or Rackspace
- Wonderful GUI which is both customizable and dynamic
- Real-time reporting
Monitis CONS
- Very focused on Linux and Windows
- Has difficulties to add ad-hoc monitoring
- Doesn’t have a free unlicensed version
Free version: There really is none. Although, they do offer their monitor.us version, but its features are really basic and recommended for simple websites or blogs.
6. Icinga
Icinga comes from part of the Nagios core, over which the GUI was improved. It can be integrated with many databases and its REST API interface is outstanding for integrating other applications. It’s focused on complex networks and monitoring protocols, machine resources and servers.
In 2009 a Nagios fork was created, and since then it’s followed its own path. In its last version (released 2014) they tried to fix performance issues by rewriting the core code. We think that it’s taking the same route as Nagios. It was well received back in 2009, but after a great launch, it started to fall back in demand terms. This is yet another monitoring tool that uses the Nagios core.
Open version: Yes
Icinga PROS
- Nagios core clone, technically improved.
- Most of Nagios plugins and extensions work on Icinga
Icinga CONS
- As Nagios, most of its configuration is based on scripts / text files.
- It’s hard to integrate modern systems that requires more dynamism (virtual environments, cloud…)
- Steep learning curve.
7. Manage Engine / OPManager
Manage Engine belongs to the Zoho Group, the giant enterprise conglomerate from India, and it’s one of those monitoring softwares to keep in mind. It’s tendency regarding demand is slightly on the rise.
What we should warn about is its really steep learning curve, which may be expensive in resources, money and time in the beginning.
Open version: Non-existent
ManageEngine PROS
- Easy to install
- Very friendly GUI
- Offers a very wide range of features to cover
ManageEngine CONS
- Complex configurations that require a lot of documentation. Very steep learning curve.
- Complicated user experience when navigating through its screens
- Alarm levels limited to basics (warnings and critical status)
- Only available on Linux and Windows
- Lacks inventory and event correlation
- Non-existing features for large environments that are acostumed to work with events, deployment on large architectures, etc.
8. Observium
Observium is a multiplatform web monitoring tool (mainly focused on Linux, Unix, HP). It’s a good tool, but it lacks basic features which in some cases we can recommend complementing with Nagios or Cacti.
Open version: Yes.
Observium PROS
- Graphs on Observium are known for their amount of detail and its careful design. It’s interesting for showing command panels on management levels.
- Easy and useable interface
- Capable of monitoring large installations
Observium CONS
- We weren’t able to configure alerts on the free version.
9. Op5 Monitor
One of the monitoring tools that’s more focused on hardware, network traffic, and service monitoring. It’s based on Nagios as well.
It has the capability to monitor multiple platforms. It also monitors cloud systems and virtual environments. We can highlight it’s capacity when it comes to large environments and its scaling on these.
From 2008 to 2010 it had a raise in demand. Ever since then, it’s slow descent has begun. Its market is still Sweden, its country of origin.
Open version: They have a free version
Op5 Monitor PROS
- Easy to use
- Very good load balancing system
Op5 Monitor CONS
- Hard to extend features and monitoring processes on our own.
- It won’t allow deployments from the console, so they have to be done manually
10. Opsview
A tool focused on network and application monitoring. It began developing in 2003, and like many other tools seen here, it started from a version of Nagios. It has a free version available.
In our office we personally like this product quite a lot, even if its demand is declining. Be careful with the tool’s performance.
The demand tendency for OPSView is quite similar to that of OP5, until 2012 it has a large raise, and from then on its decline has been quick.
Open version: Yes
OpsView PROS
- It’s a rewritten Nagios, some of its plugins works in OpsView
OpsView CONS
- Very rigid monitoring panel
- Limited reports that cannot be exported
- The amount of developed plugins is reduced
11. PRTG Network Monitor
Network monitoring tool that stands out for its greatly designed and easy to use interface. It has a great vantage point when it comes to configuring alerts flexibly and because of its report generating capacities. The free version (which is NOT open) is limited to monitoring 100 application types.
PRTG is an application that can only be executed on Windows machines as a part of Microsoft Network Monitoring. Anyway, we highlight that the monitoring is multi-platform and is also able to monitor virtual systems and cloud applications. It can also generate real-time reports.
Despite decreasing, its trend has been stable throughout the years:
Open version: Yes, but very reduced.
PRTG Network Monitor PROS
- Very nice interface with awesome data navigation possibilities.
- You can access monitoring from mobile devices
- Reports can be in PDF/HTML formats
- Very powerful and flexible alert system
PRTG Network Monitor CONS
- Certain plugins require additional Microsoft user licenses, therefore costs can skyrocket easily
- Limited scalability
- Very rigid when implementing its own checks
- Hard to deploy in environments with a complex connectivity
- Quite inefficient when it comes to server or application monitoring
12. Solarwinds
Solarwinds is a network monitoring tool that excels for its automatic network and node mapping, without the need to manually activate it. This is added to a very powerful GUI that allows you to easily view your network topology and its status. Solarwinds also allows integrating virtual machines in its monitoring.
A very good option for medium sized companies that can afford the license costs (it’s one of the most expensive tools).
Its tendency shows that after a crushing success experienced during 2004 and 2005, a descent happened in which they’re now relatively stagnated. In fact, December 2020 abrupt rebound, far from being positive, marks the worst moment in Solarwinds Inc history, as it comes from the official notice of the hack Solarwinds systems suffered throughout several months.
Open version: No.
Solarwinds PROS
- Great GUI
- Wonderful community backing it
- Mobile device access
Solarwinds CONS
- File and manual configuration for alerts
- The report generation system still has room to improve
- It doesn’t have integration with cloud applications such as Amazon
- You cannot perform all actions from the same panel and you’ll always require to access other tools
- Its licensing forces the user to constantly look at every check performed, since licensing is individually done for these.
13. Whatsup Gold
Whatsup Gold is one of the best network monitoring tools when it comes to balancing system loads. Its scaling is horizontal and allows the use of various processes to distribute loads. It’s capable of performing some automatic actions based on events that have occurred.
Just like other tools like SolarWinds or Pandora FMS, it has a system to discover networks and topologies.
By creating proprietary scripts you can add and integrate more applications or services within the monitoring.
We can also connect from mobile devices to access the monitoring panel. Alerts can be set to be sent via email, SMS or through other options and information is offered in real time.
Despite that, search trend is decreasing:
Open version: No.
Whatsup Gold PROS
- Easy to configure and process network discoveries
- Reports
Whatsup Gold CONS
- Navigation and console are not that intuitive
- Configuration is split between web configurations and manual configurations on the console
- Limited scalability
- Quite poor for monitoring servers or applications
14. OpenNMS
After the large number of requests to review this monitoring tool, we have reviewed and added OpenNMS to this list.
OpenNMS is a 100% open source network monitoring tool, with no licensing requirements. The business model is to offer the software free and monetize it through consulting services, provided by the OpenNMS group, who administrate the product, through various business lines, including training and support services.
As one can see in the graph, demand for OpenNMS has been on a steady decline for the last decade.
Open version: Yes.
OpenNMS PROS
- It’s a flexible and high-capacity network monitoring tool, but one of its chief problems is the steep learning curve associated with it, plus an unintuitive GUI.
- Integrates well with alert systems supports like SMS and email.
- An active community around the tool, and a detailed wiki.
- Can perform similarly to other, licensed products, but requires more time to learn to use and to configure
OpenNMS CONS
- Requires a “hands-on” style of configuration, based on script editing and XMLs. In this aspect, it resembles Nagios a lot, in that a manual configuration can lead to highly idiosyncratic installations which can be difficult to decipher.
- Importing third-party MIBs can be problematic.
- The reports it is capable of generating are not polished enough for executive/management eyes, being quite basic visually, and without the possibility for fine-tuning intervals. In fact, it can’t present information in real-time, nor fine-tune intervals to below 24 hours.
- Most importantly, OpenNMS, as its name suggests, is focused on network monitoring, and does not cover the full range of services which a more complete monitoring service can provide, such as server or application monitoring, and much less business processes and user experience. Due to its lack of agents, the information it can retrieve from the system under monitorization is limited to what is retrievable through SNMP, and that is not enough when it comes to monitoring applications or elements of server infrastructure. In some cases (not our own) it has been possible to use Nagios agents in an OpenNMS integration, although we can’t consider that an optimal solution.
15. Cacti
Cacti is a comprehensive monitoring solution for network graphic generation, designed to harness storage power and functionality for RRDtool app graphics.
Its user interface is easy to use, which is convenient for LAN sized systems.
Search trend Cacti evolution still has a solid foundation:
Open version: Yes, it only has open version.
More in depth comparison here: Cacti vs Nagios vs Pandora FMS in depth comparison
Cacti PROS
- Easy to instal and use.
- Does what it say it does and makes what you expect from it.
Cacti CONS
- Basic.
- It’s only used for display data in graphics.
- More modern tools (grafana) are replacing it.
- It does not scales ok.
- Some basic functionalities are missing in a monitoring environment (events, notifications, reports, SLAs, network maps, dashboards, multitenancy…).
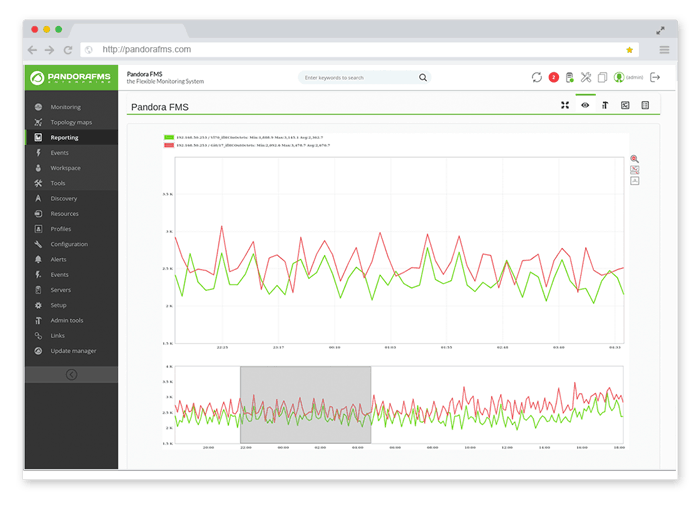
16. Pandora FMS
The open version is capable of monitoring over 10,000 nodes and covers (without limitations) network, server (both with agents or remotely), and application monitoring. With features full of reports, alerts, and third party integrations through API, etc.
Differently from others, it doesn’t have Nagios core as a starting point. Instead, Pandora FMS created its own architecture from scratch, which allows perfect scaling for large environments. A network with over 100,000 nodes has been monitored with Pandora without performance issues (with the Enterprise version).
We also highlight its integration on mobile devices, which not only allows access to the console, but also to monitoring, thanks to its geolocation system.
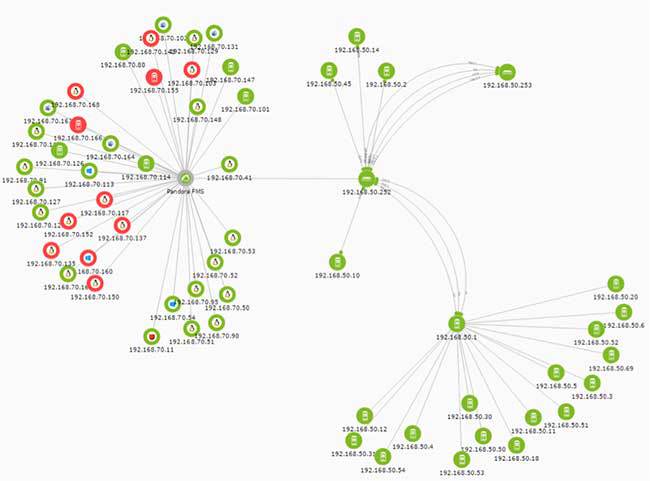
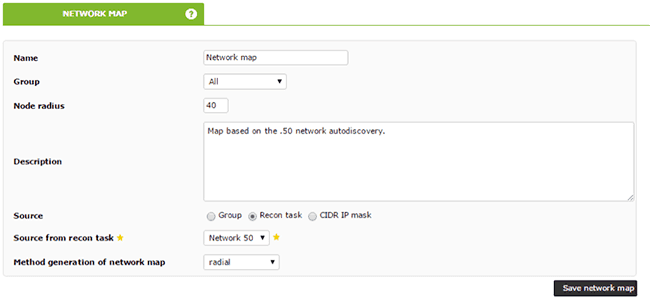
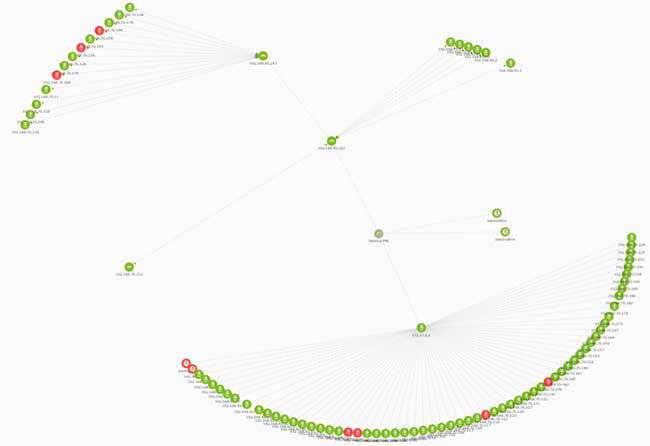
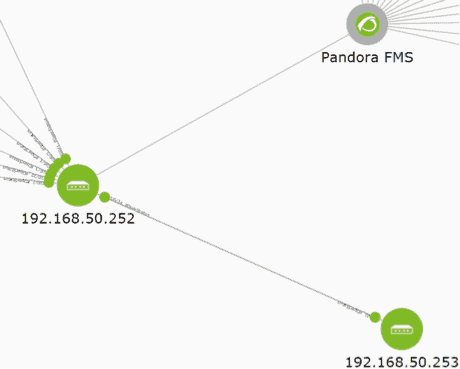
Its network autodiscovery system is capable of finding all the elements that compose your network in a short time.
Time search evolution in Pandora Flexible Monitoring Software has been stable, with some isolated variations:
Open version: Yes.
More in depth comparison here:
Pandora FMS PROS
- Capable of every monitoring type (servers, networks, applications…) with a single console.
- Great flexibility and scalability (dozens of thousands of devices).
- Dynamic network maps, reports, SLA’s, integrated notifications, service’s maps, events, logs…, and more.
- It’s an all-in-one monitoring software.
Pandora FMS CONS
- Community not as big as Zabbix’s or Nagios’
Conclusions
We know that there’s a lot of competition and many options, and it is honestly quite difficult to choose the best option. With this monitoring tool comparison guide you’d have all you need to make proper decision
Most network monitoring tools that we mention are meant for small and medium enterprises. It’s difficult to find tools for large companies that actually cut it for them in performance, and that also support different technologies and protocols that this type of company needs. Within this category we can mention ZenOSS and Pandora FMS.
You should also take into account that this article discusses network monitoring tools and, today, it’s more important not only to know the status of networks and applications, but to be able to understand how a business works, from the bit that goes along a network cable, to sales being done at a specific time by a specific company. This point is related to business activity monitoring, or operational intelligence; but that’s better left for another article.