What is Pandora FMS Open Source?
Pandora FMS Open Source is not a freemium software, it is not bloatware nor shareware (*Wink for those born before the 80s). Pandora FMS is licensed under GPL 2.0 and the first line of code was written in 2004 by Sancho Lerena, the company’s current CEO.
At that time, free software was in full swing and MySQL was still an independent company, as was SUN Microsystems. Today there are thousands of users of the Open Source version that regularly download updates through the system that we designed for that specific purpose.
We do not know more about the subject (neither their names, nor their companies…) because, above all, we respect privacy.
We consider Pandora FMS to be a real free software. The project has been active in Sourceforge since 2004 and we have all the awards granted by this entity that leads Open Source. All the code is available on Github in real time, but we do believe that there is something more important and that is the documentation we have available in five languages (Spanish, English, French, Japanese and Russian), with a level of depth that allows you to get the most out of it without having to pay for certifications, training or consulting.
Printed, the manual has more than 1,000 pages (per language) and is maintained by our professional development team, Q&A, translators and professional documentalists. We also have a public forum where we solve questions, with more than 15,000 messages.
We believe that freedom consists in offering users options, not just giving them part of the pieces of a puzzle without instructions.
Pandora FMS Enterprise
However, Pandora FMS has a version based on a commercial license that extends some of the features present in Pandora FMS OpenSource version. This license incorporates additional source code that is not publicly available or free of charge.
These features are oriented to demanding professional environments that require some automation and more specific tools already created to use them in operation and with professional support so that if something fails they can ask and get a patch if necessary. It is exactly for these types of environments that we designed Pandora FMS Enterprise.
If you want to use Pandora FMS Community and have doubts about whether it will be enough for your organization: Don’t hesitate!, it is not a question of size, we have users of the Open version with thousands of agents and who have been using it for years.
Obviously the main benefit of the Enterprise version is that you will have someone to support you at all times. Whether it is some problem with an update or throughout the installation of a plugin. But there are many small differences that can be key to optimizing your day-to-day management.
Next we will describe some of the Enterprise features. If you want to try them yourself, you can test the waters of a 30-day trial version, but let us show it to you at an online meeting and you’ll save yourself the trouble of messing with the software. Your time is valuable and while our documentation is extensive, PFMS has plenty of features.
Services
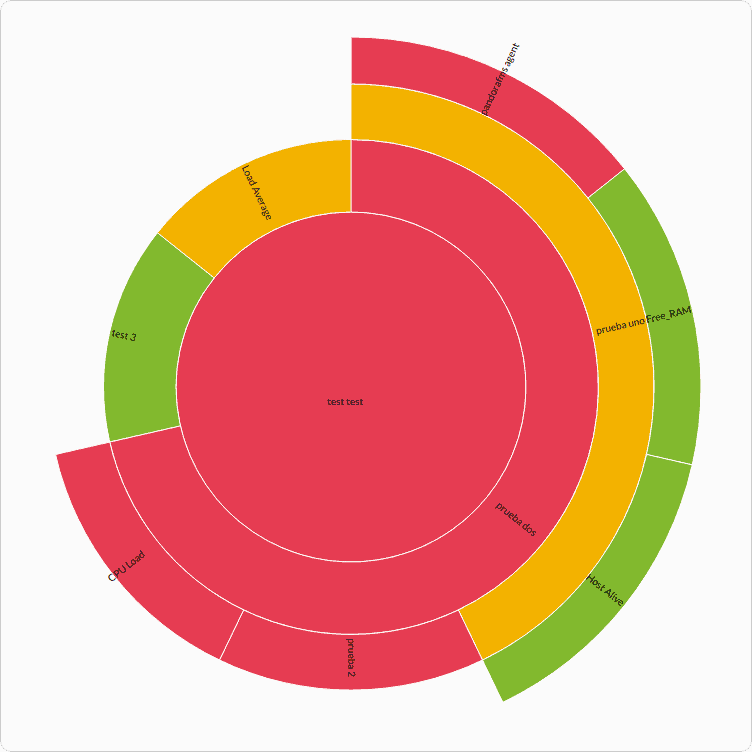
Services are the way to show in a simple and visual way what things are like in your organization, classified into different entities that in turn are made up of other services and / or metrics.
That way you may perform an automatic root cause analysis and find out when a service is affected, where the source is and even have it displayed in the form of a tree:
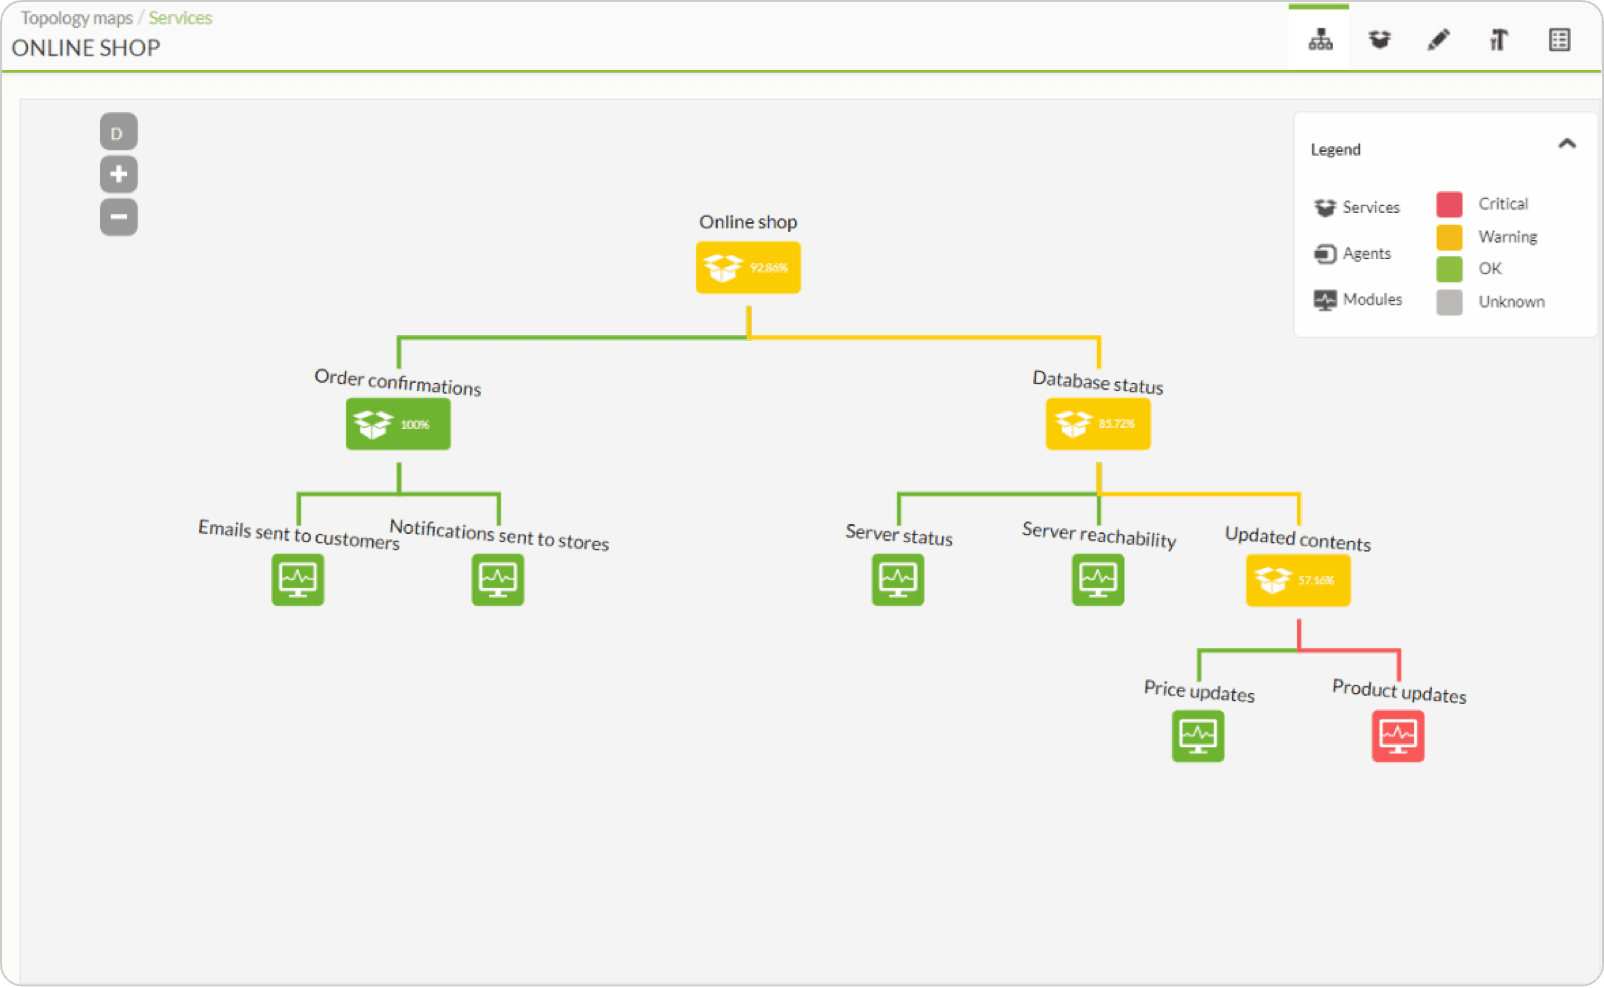
Services complement the existing display options in Pandora FMS and allow system managers to define weight rules that have their systems’ redundancy to alert only in case of need, not when something irrelevant fails.
↑ Go to index
Policies
The need arose from a client who managed many computers with different purposes and technologies. They found out that monitoring Windows 2000 computers was different from monitoring Windows 2003, and that of course the Redhat Linux had different needs from the Debian Linux. It also had differentiated database environments, such as DB2 or MySQL.
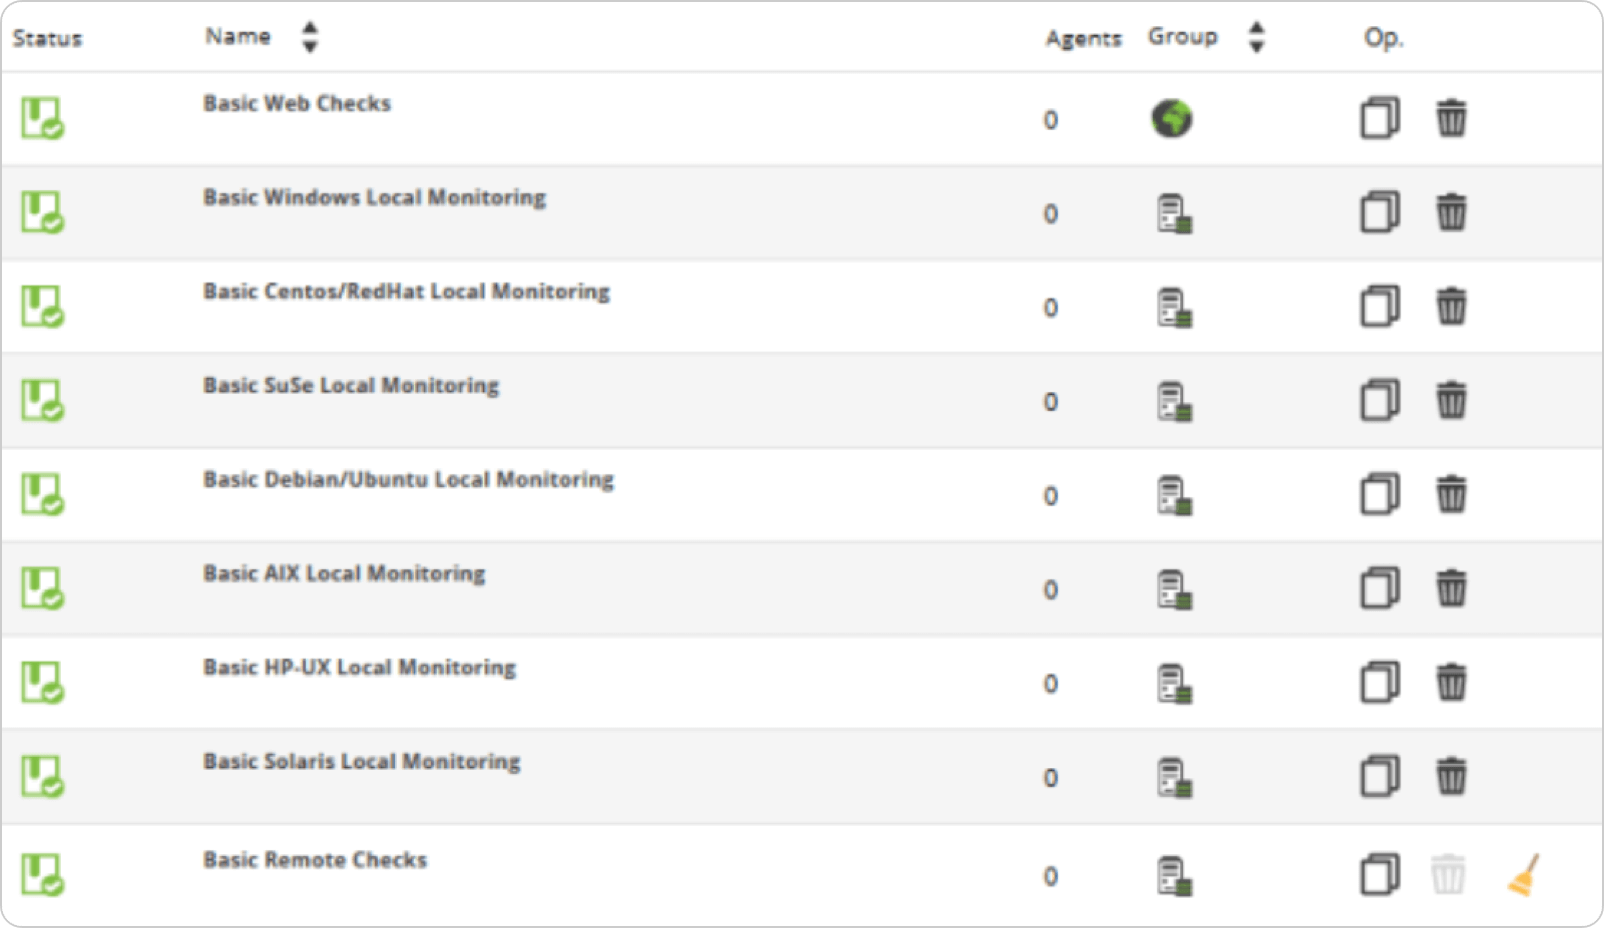
Base monitoring could be “compartmentalized” into different sets of checks that could be standardized, so that any Linux machine that had Oracle could be monitored the same. That way, we made sets of checks that could be easily deployed to machine groups.
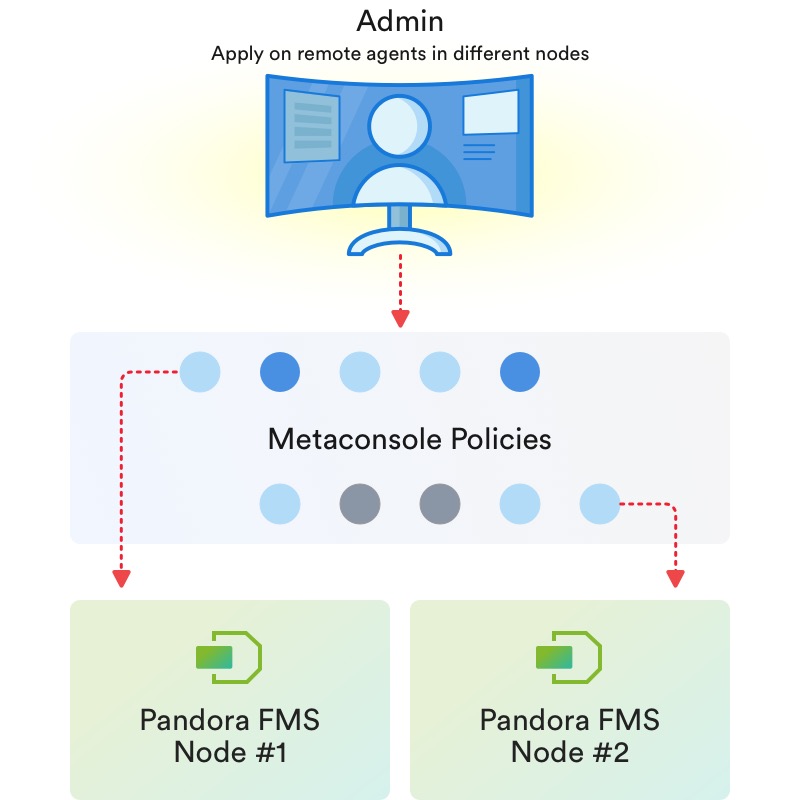
Thanks to policies, it is possible to homogenize monitoring and to deploy standard monitoring by technologies.
Thus a system can have different policies applied (e.g. base operating system, database, application X, network performance, etc.) and for every time you modify the policy, it can get “synchronized” with those systems that are subscribed to said policy, in a totally automatic way.
Of course, exceptions can always be made to policies at individual level, and each system can have unlimited policies in addition to custom monitoring. Using policy monitoring can save system administrators a huge amount of time.
↑ Go to index
Customization and OEM
If you need to sell your own monitoring product, with your own brand and full customization not only of its look, but also of its installers, command path, running services, ISO installation images, Windows agents, logos, manufacturer and product names, Pandora FMS Enterprise has different customizing levels.
The most basic, and included as standard in any Enterprise license, allows you to customize the appearance of the console so that it does not look like Pandora FMS but your own product, with your own brand.
If what you need is to go further, and generate a software with another name and that from the installation process to the name of the database everything is alien to Pandora FMS, then OEM customization is what you need. We can even generate update packages specific to your OEM (or teach you how to do it so you can fend for yourself).
↑ Go to index
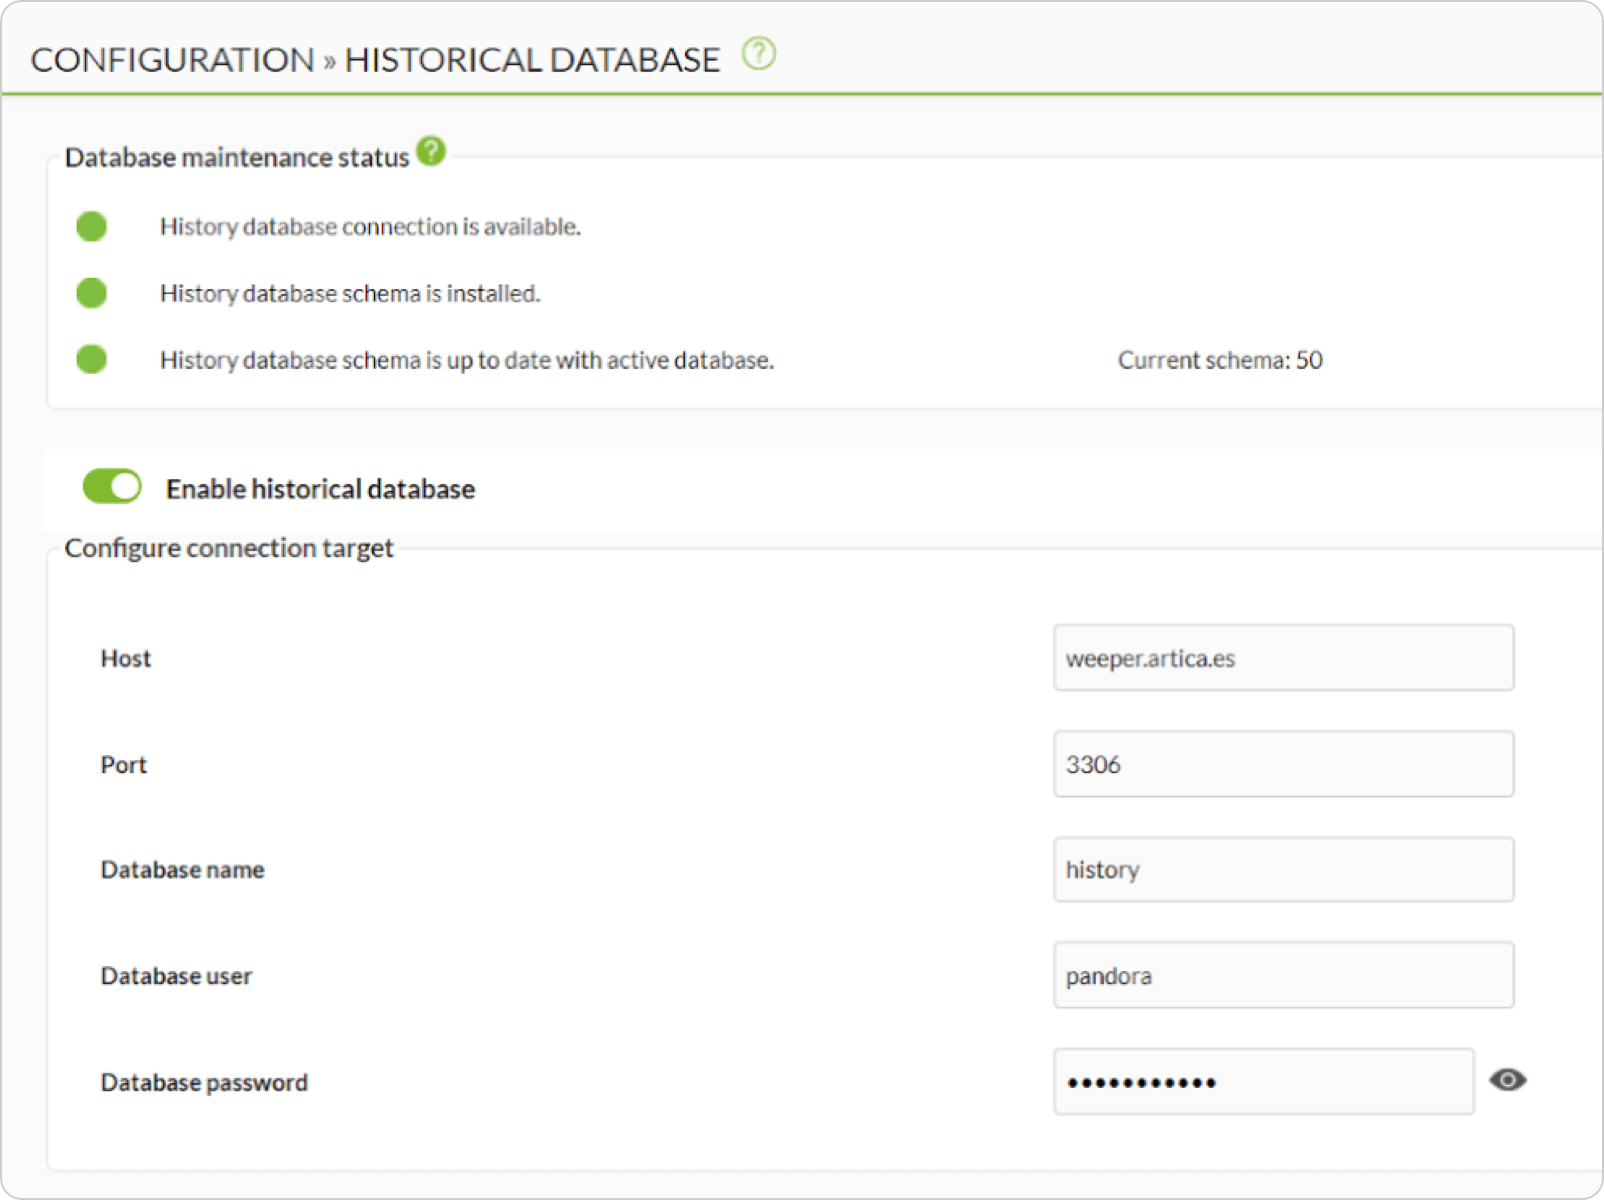
History DB
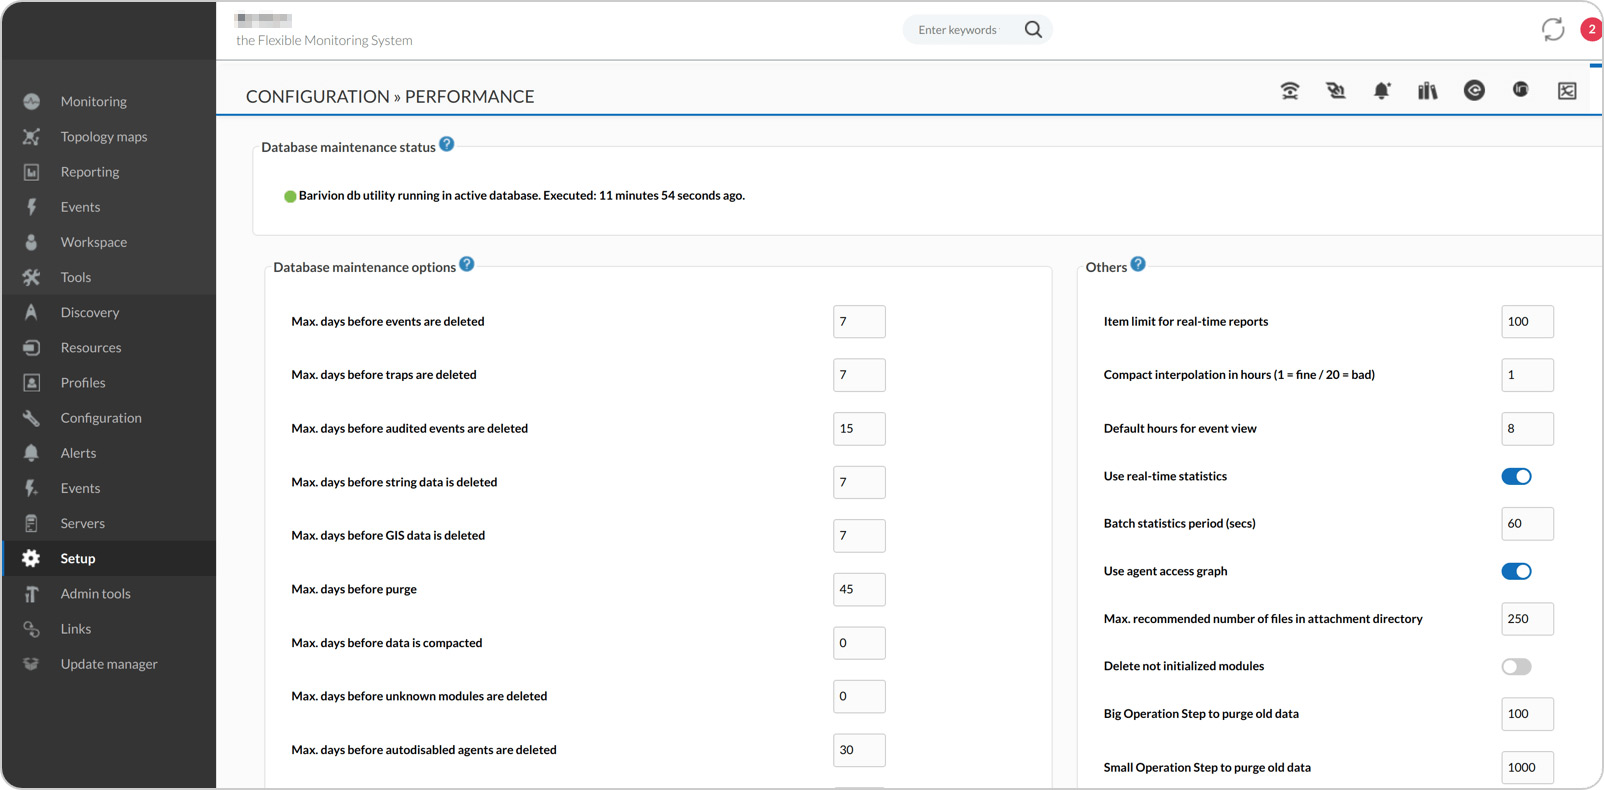
Pandora FMS Enterprise has a secondary storage system in an additional database. The system automatically transfers the data from more than N days to the history database and when it needs it to make reports or graphs, it uses both databases to gather information.
This allows you to have an almost unlimited data history (several years) without compromising the speed of access to day-to-day data.
↑ Go to index
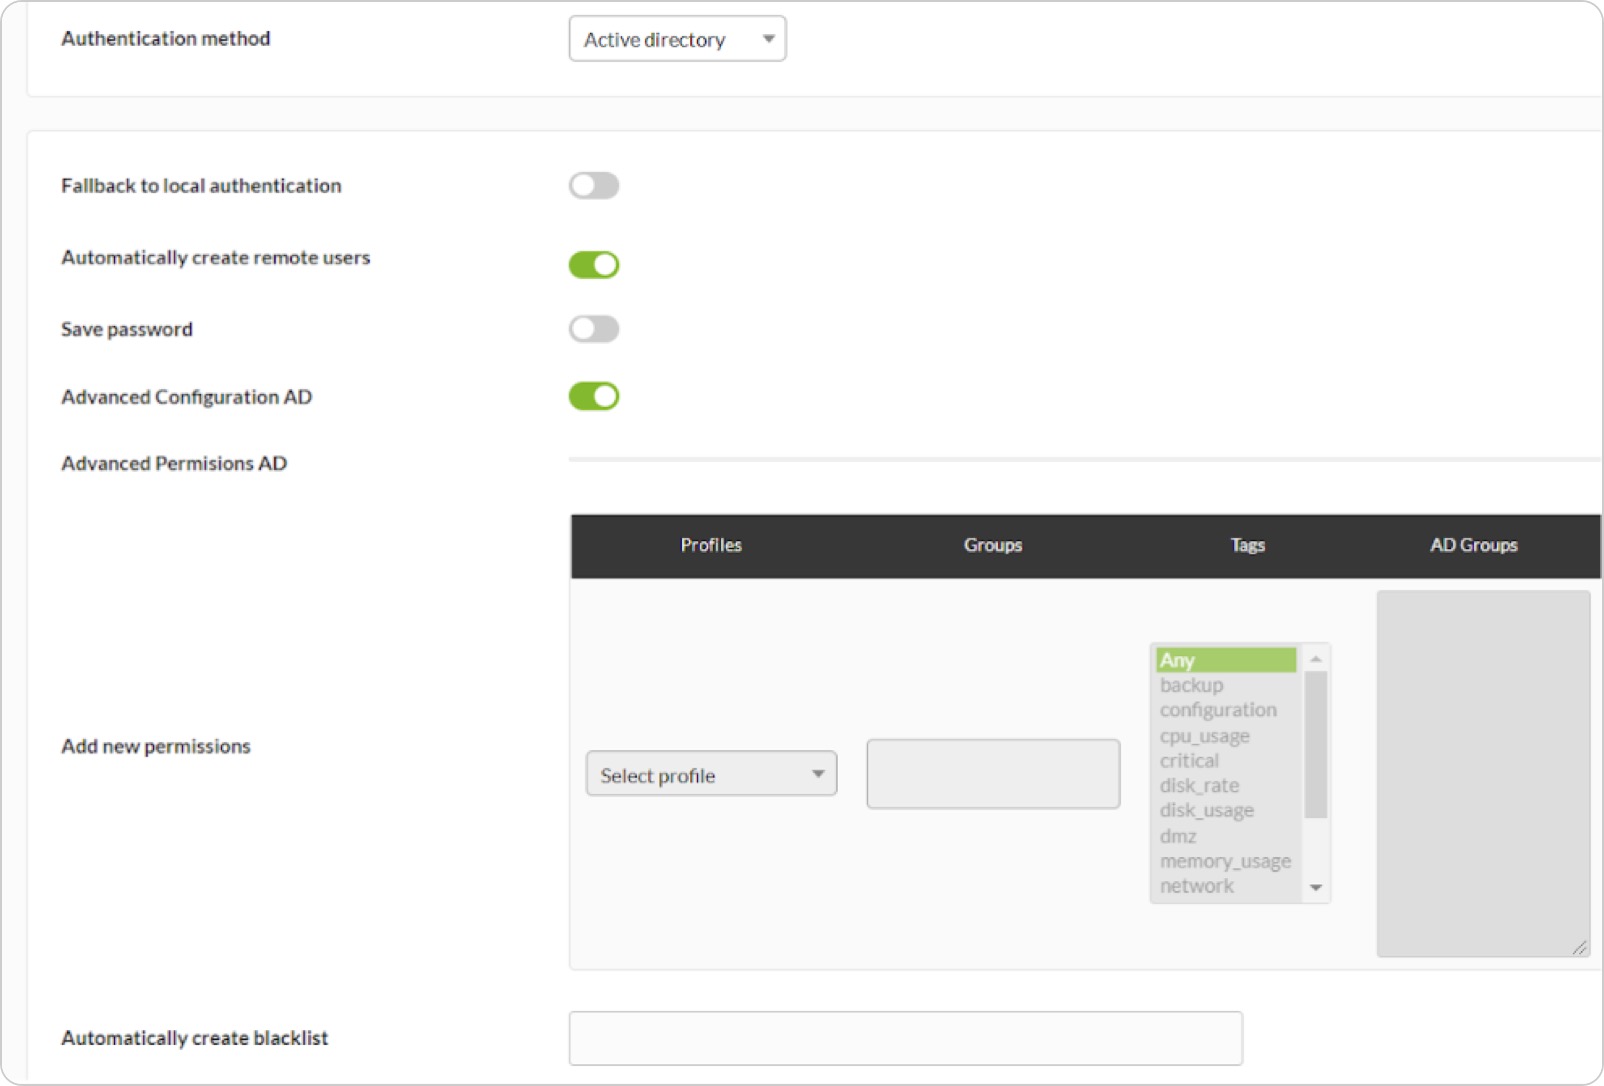
Delegated authentication in Active Directory
Whether you need your installation to rely on an Active Directory to authenticate users, or to automatically create them at login, assigning them specific profiles or filtering them through a blacklist, this feature is designed specifically for professional environments like yours.
It has advanced options such as delegating to a secondary server, excluding administrators, complementing it with double authentication through Google Auth and many other options.
↑ Go to index
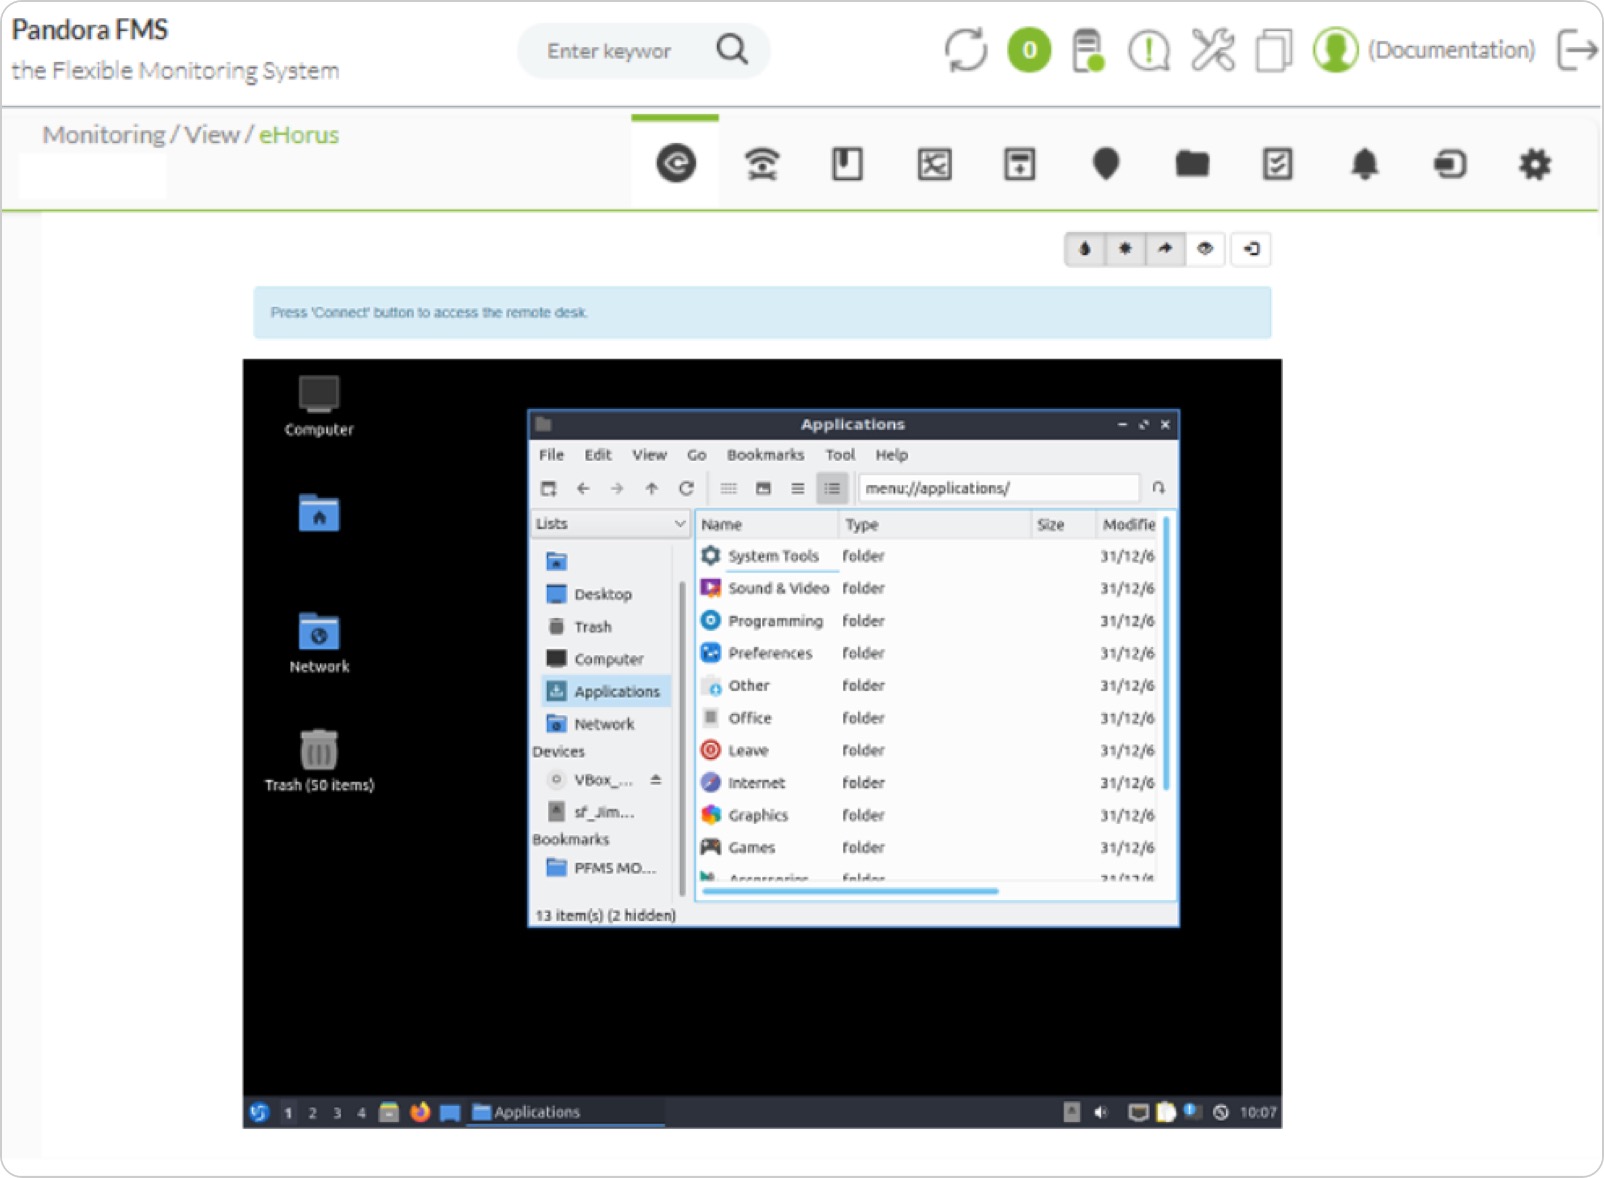
Remote control
Remotely control and access your systems, whether windows workstations, Linux or Windows servers, or Raspberry or similar embedded systems. Access the remote shell as if you were in front of it, the remote desktop, or copy files both ways. All this from the same Pandora FMS WEB console, fully integrated into your asset management.
In the Enterprise version you may have your own on-premise infrastructure of eHorus servers so that all communication among your systems can be managed and controlled, with total autonomy from third parties and with maximum security and confidentiality.
In the community version, however, you may use our Cloud servers, up to a maximum of five devices for free.
↑ Go to index
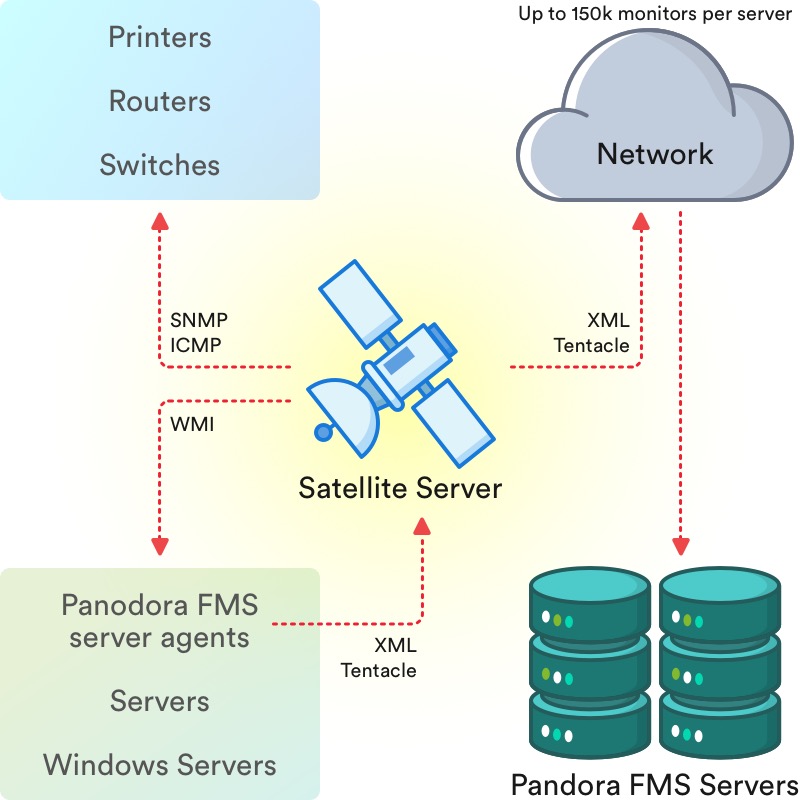
Satellite Servers
Satellite servers allow headless remote monitoring of entire networks of equipment in a distributed way. Install Satellite servers in the networks of your clients, they will obtain metrics of all kinds of devices around them, exploring what they have around them automatically and sending the information to the central server where you may manage it as if they were normal agents.
Satellite servers are perfect for making deployments in remote sites, customer offices or inaccessible environments. They can be installed on Raspberry, or any type of container.
↑ Go to index
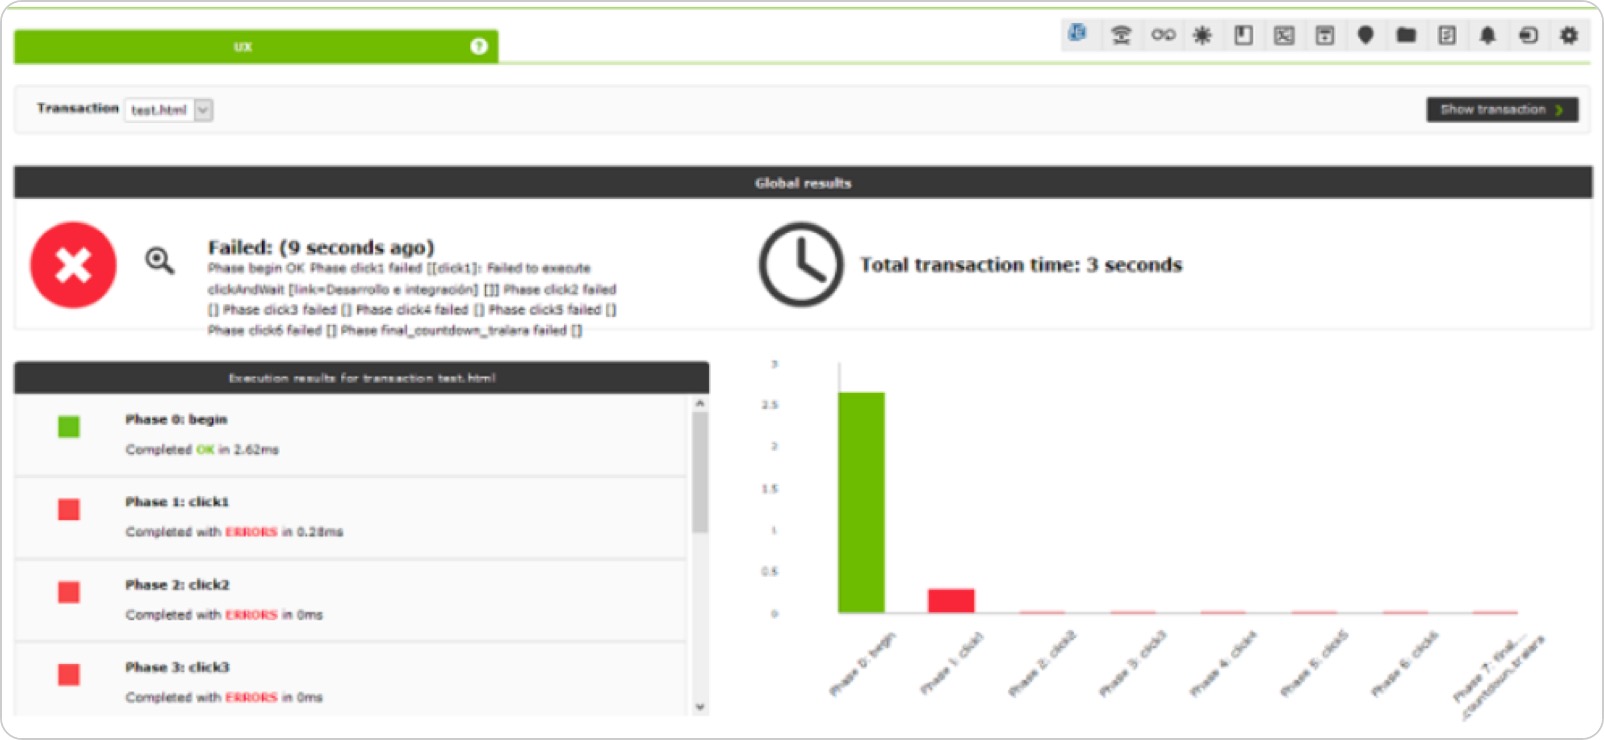
User Experience (UX) Monitoring
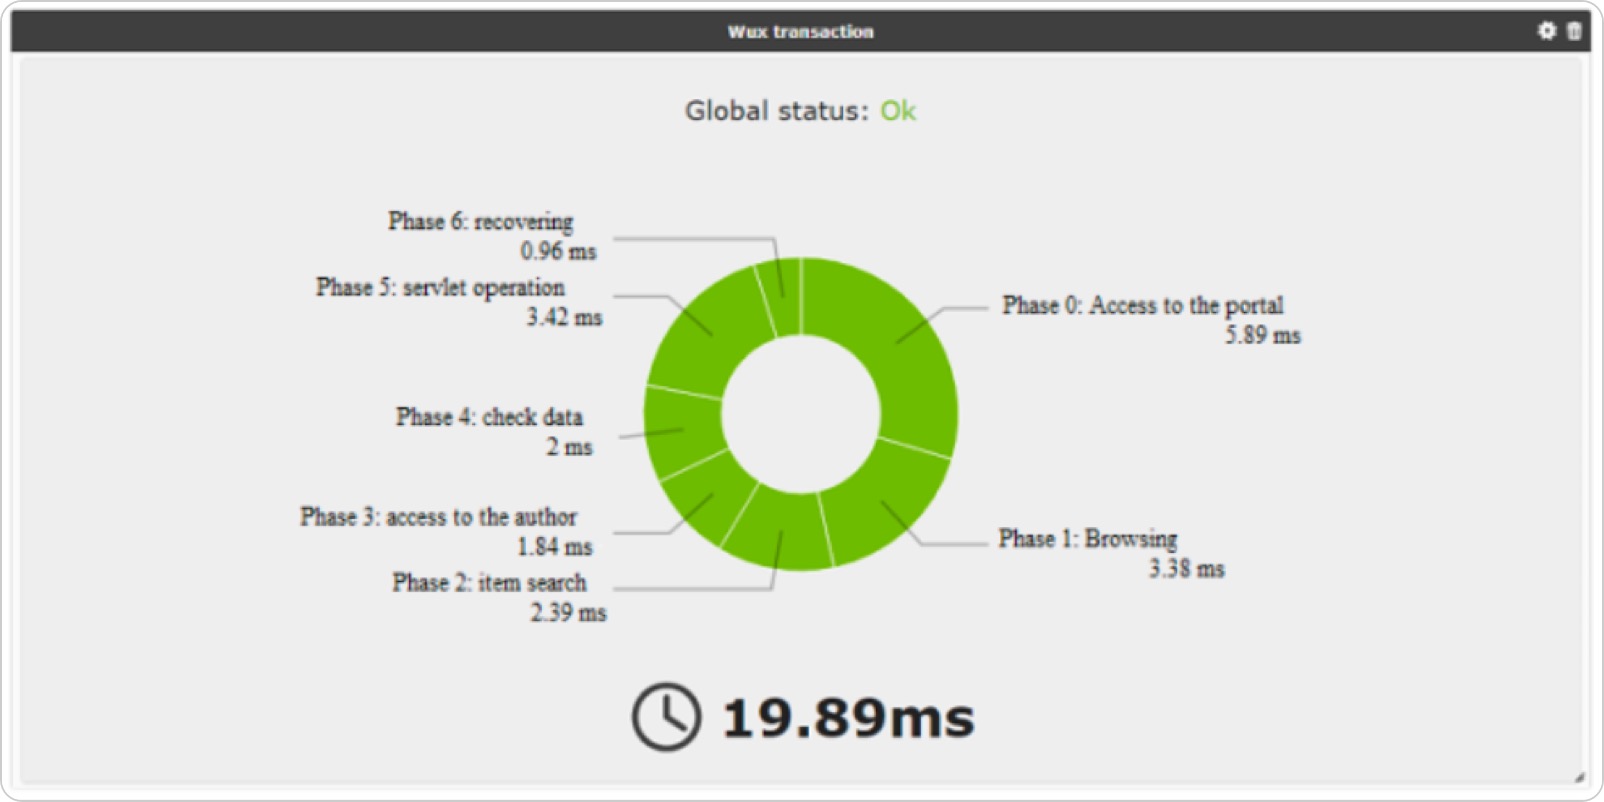
Nothing like observing things pretending to be a real user, if possible from the same chair as the real user. This is what user monitoring consists of, replicating a transaction from beginning to end, step by step, calculating the time it takes in each step, and verifying that each step is completed correctly.
That way you will not only find out whether it fails, but you will also know where, and how long each step takes. You may even take a screenshot to know what the fault looked like. This can be done for web applications (even if they have Java, Flash, HTML5, etc.), and also for traditional desktop applications. It can be done centrally (WUX) or in a distributed way so that the probes perform the tests from different geographical locations.
↑ Go to index
Remote agent deployment
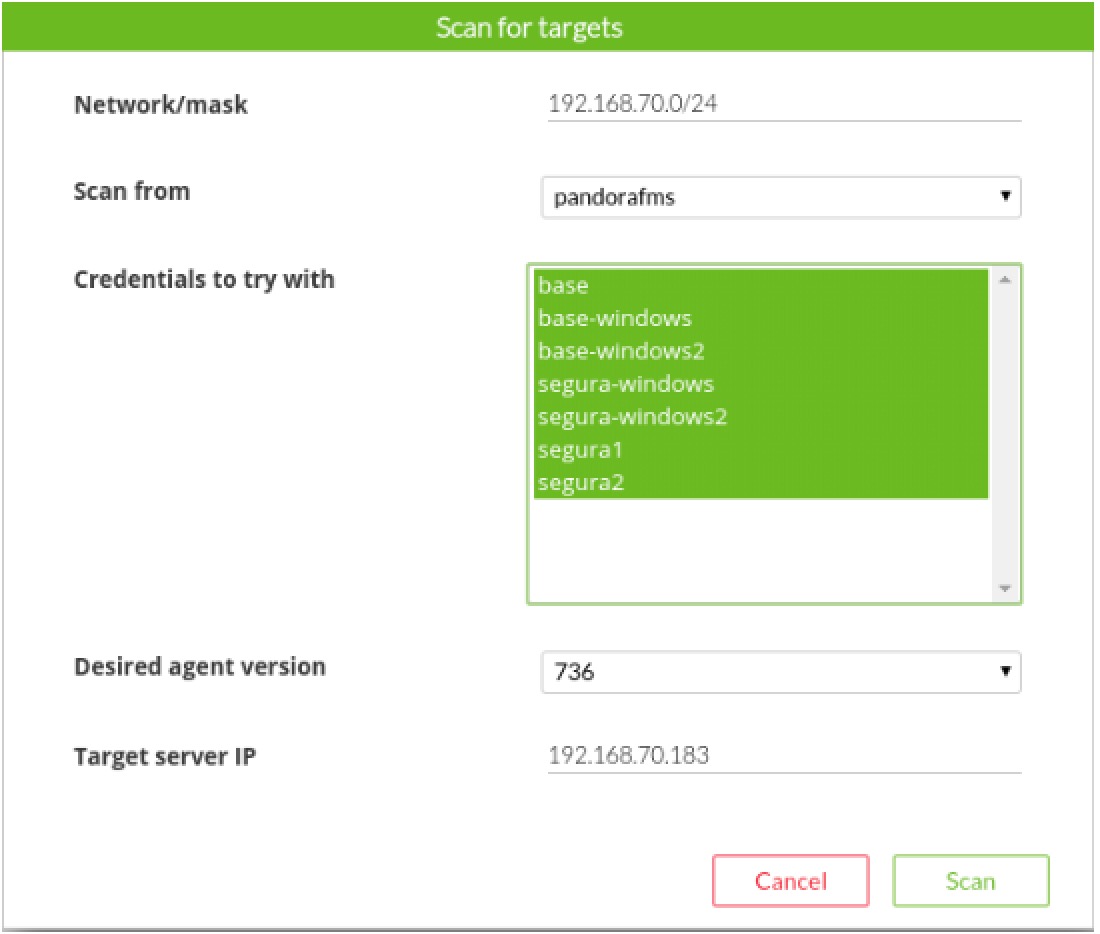
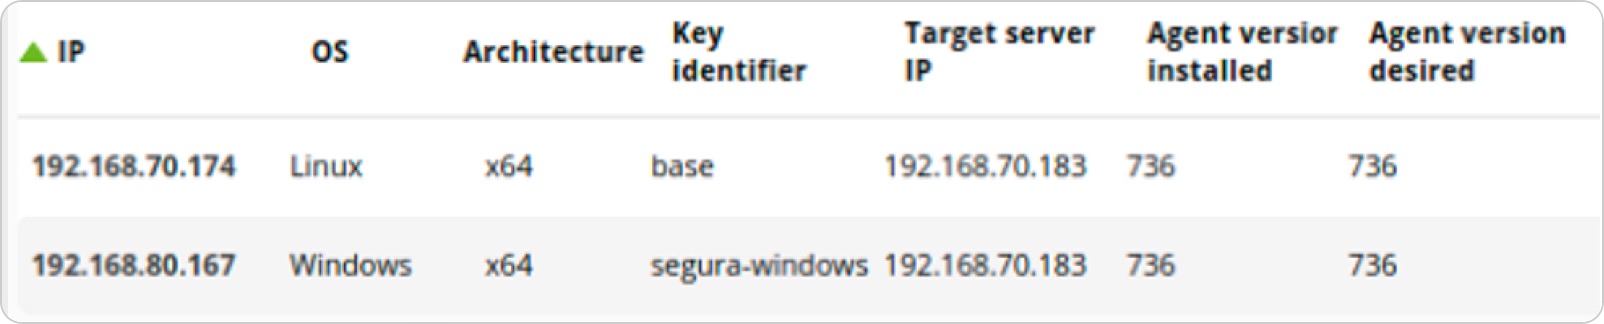
We know that deploying agents and configuring them is one of the most burdensome points of deploying monitoring. That is why we created a tool that allows, providing credentials, to connect to Windows or Linux systems to copy the agent and carry out its unattended installation.
It allows you to customize the installation, by different networks, environments or groups of machines. From dozens to thousands of systems can be installed or upgraded from the agent deployment console.
↑ Go to index
Omnishell
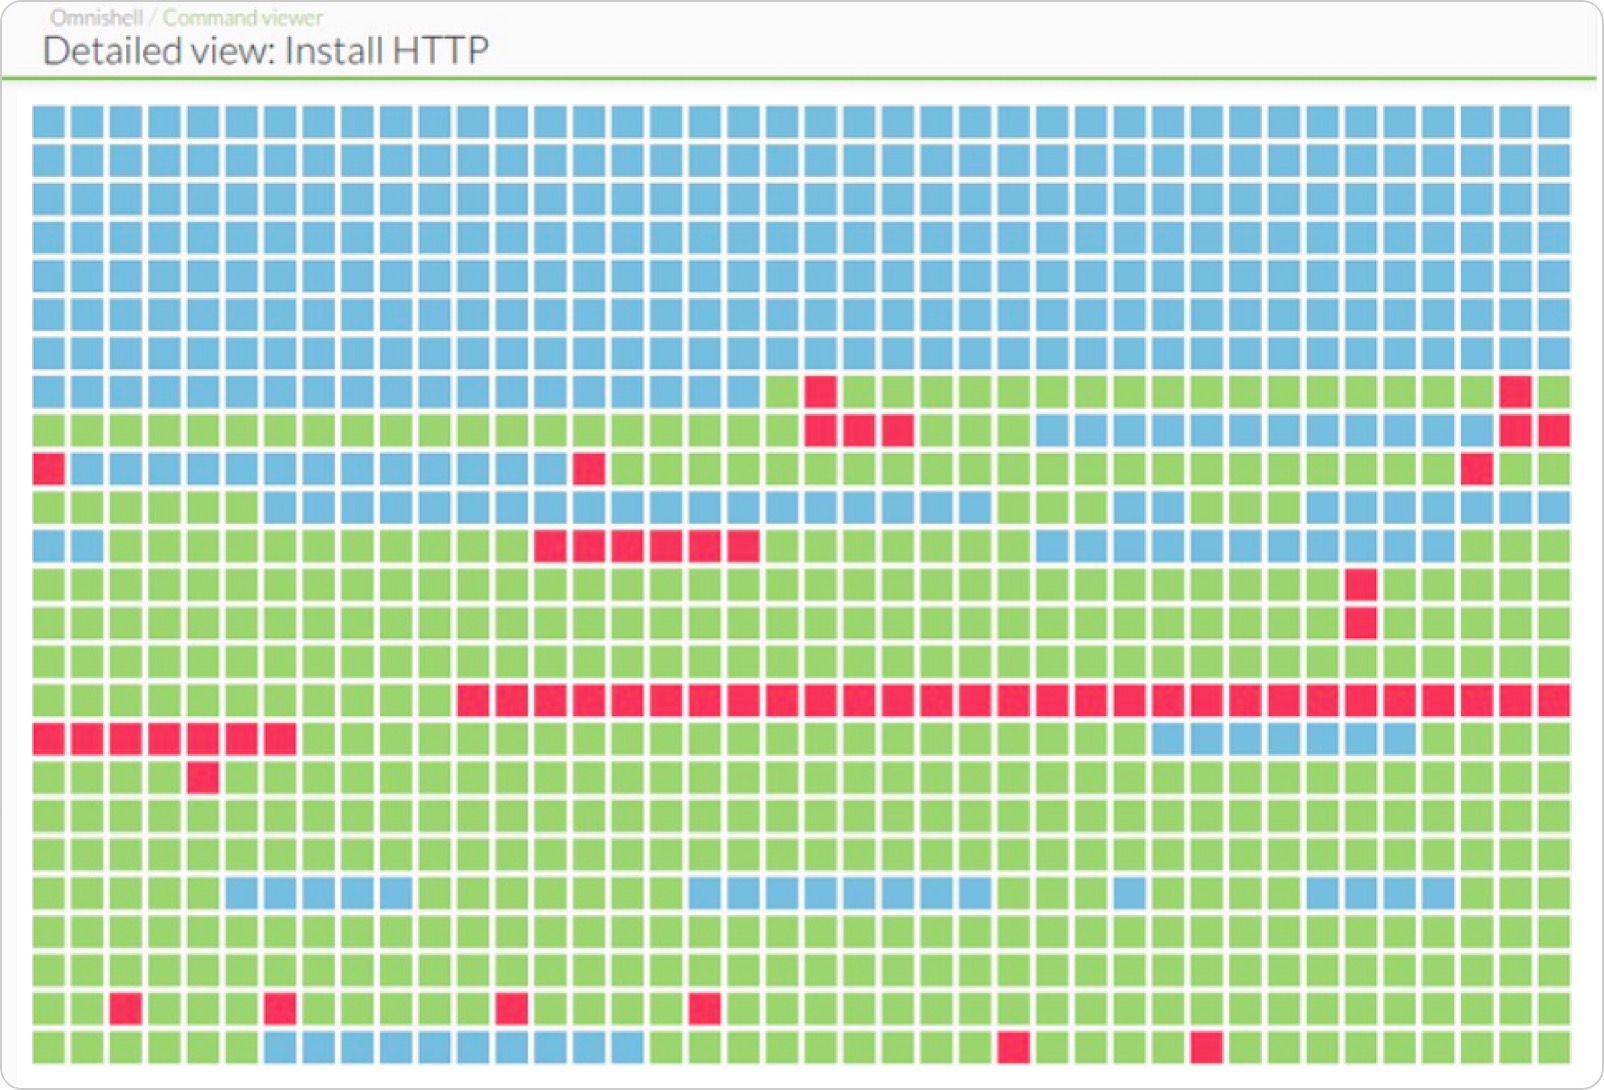
Omnishell is a Pandora FMS Enterprise feature that is used for orchestration (IT automation). It is a fully native tool integrated into the console that uses PFMS agents to execute command blocks on selected targets.
A use example would be to configure the auto-start of the HTTPD service on CentOS 7 systems massively. Another example could be to install a manual patch on those Windows machines that you select from a list. It can be one or several hundred machines.
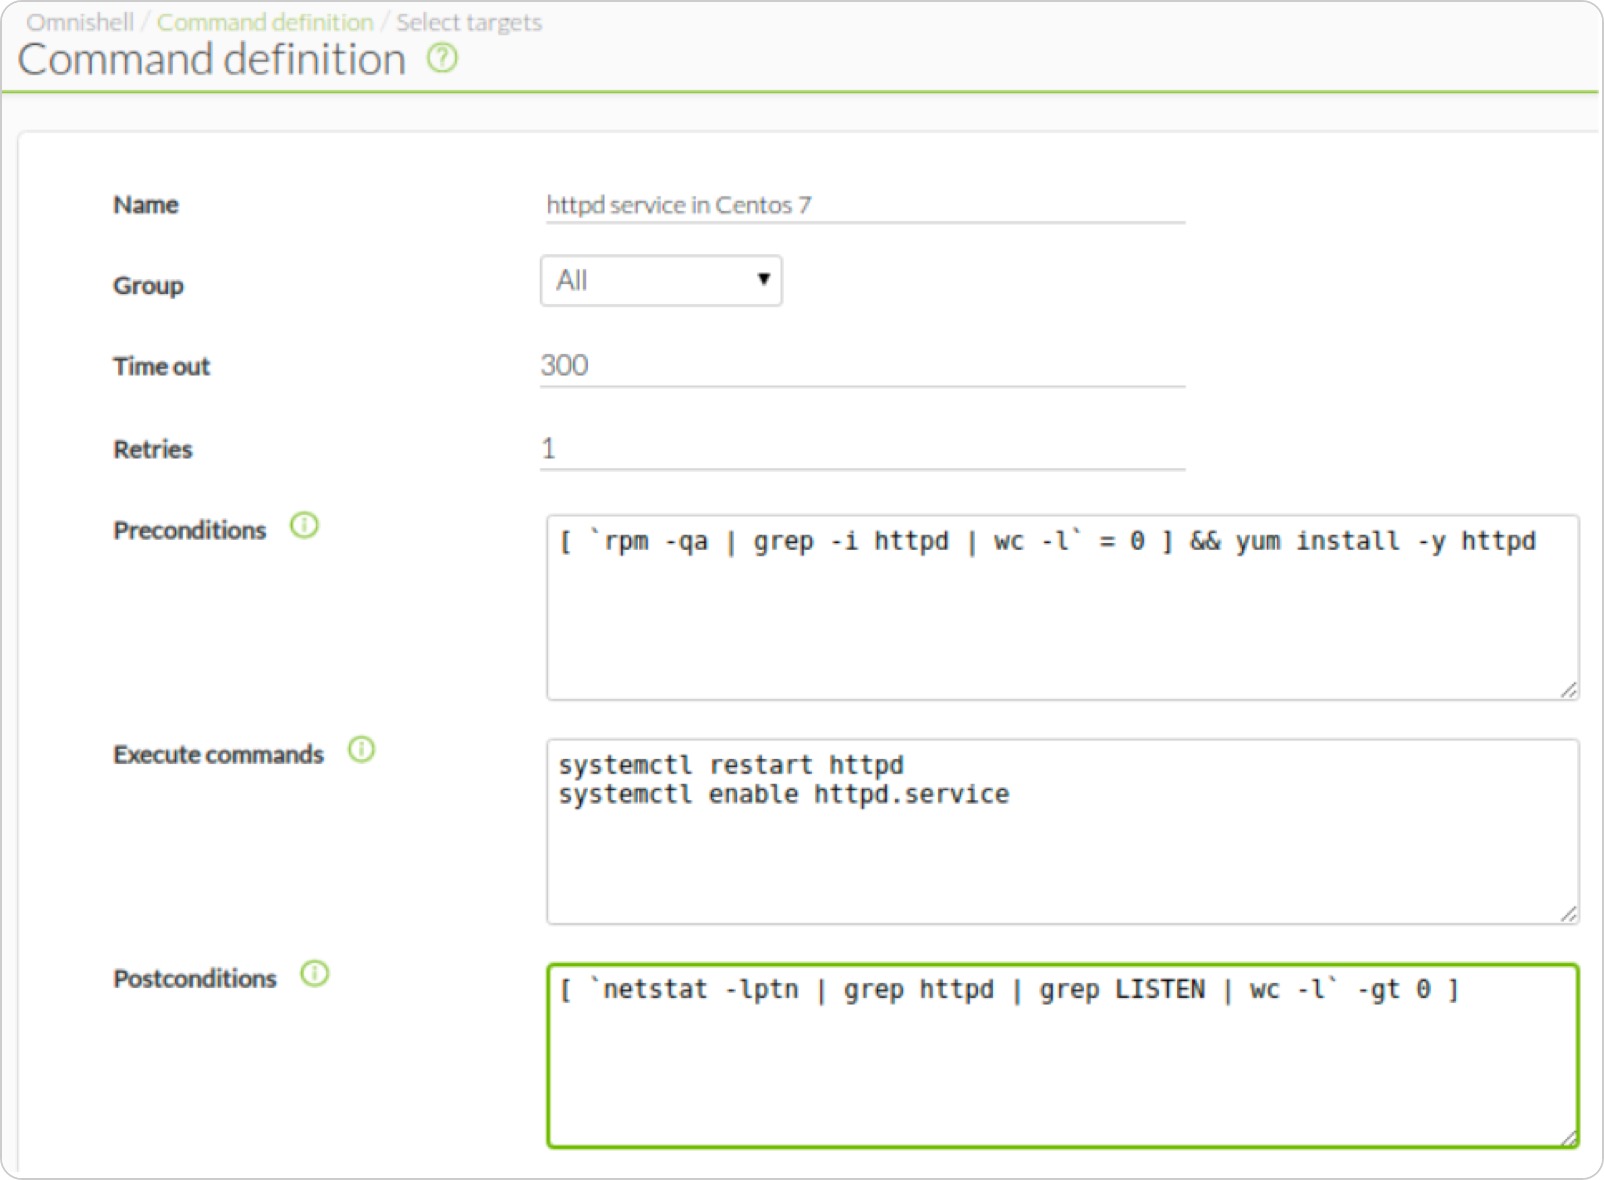
The system is designed to be executed on hundreds of systems simultaneously and wait for the order to be executed, showing on the screen the progress, machine by machine:
↑ Go to index
Auto Provisioning and automatic agent configuration
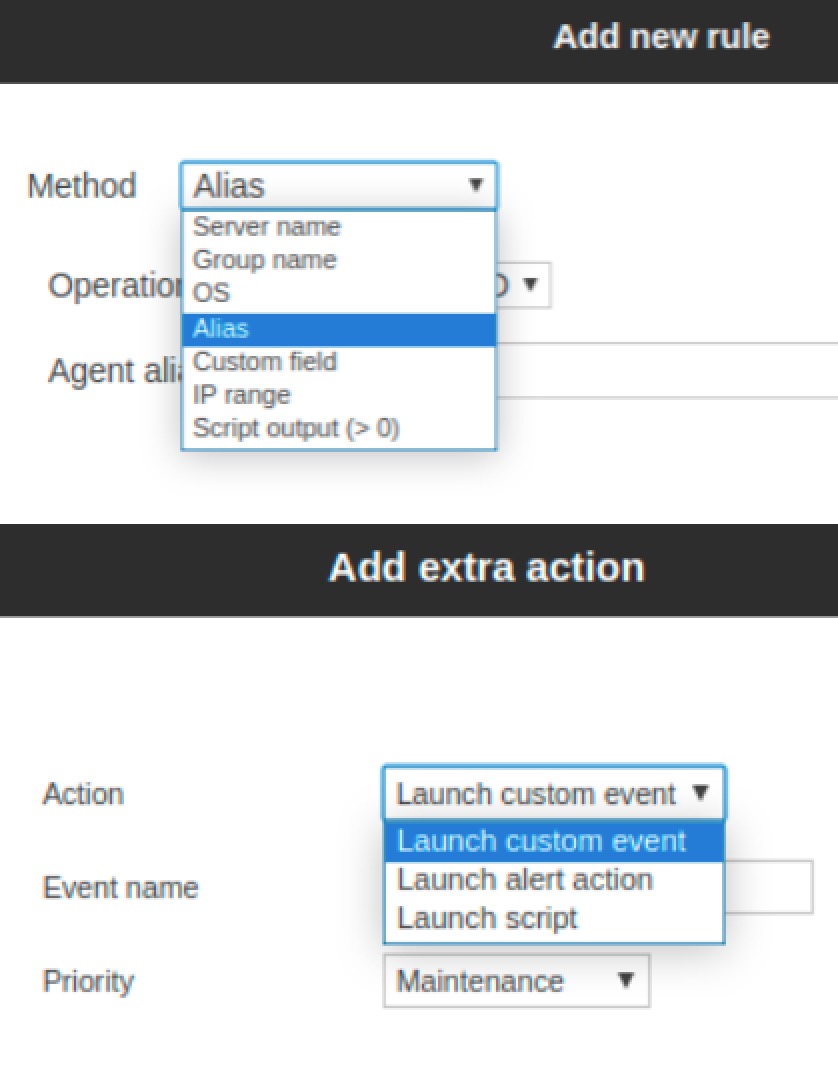
It implements an automatic mechanism by which it can apply policies and changes to newly provisioned agents, so that after deployment, monitoring configuration is automated, assigning it group(s), monitoring policies, alerts, etc.
This customization is done based on rules. For example, having a certain IP range, a specific brand or custom field, or a hostname with a certain pattern. In addition, after you make the configuration change, you may generate a custom action.
↑ Go to index
Collections
Deploying advanced monitoring requires bringing scripts and small applications (ours, yours or from third parties) to the monitored systems, to be executed by the agent in the form of plugins.
Collections allow you to gather this set of files and send them them to agents in an integrated way in the policies. That way, using plugins is something simple and transparent for the final operation.
↑ Go to index
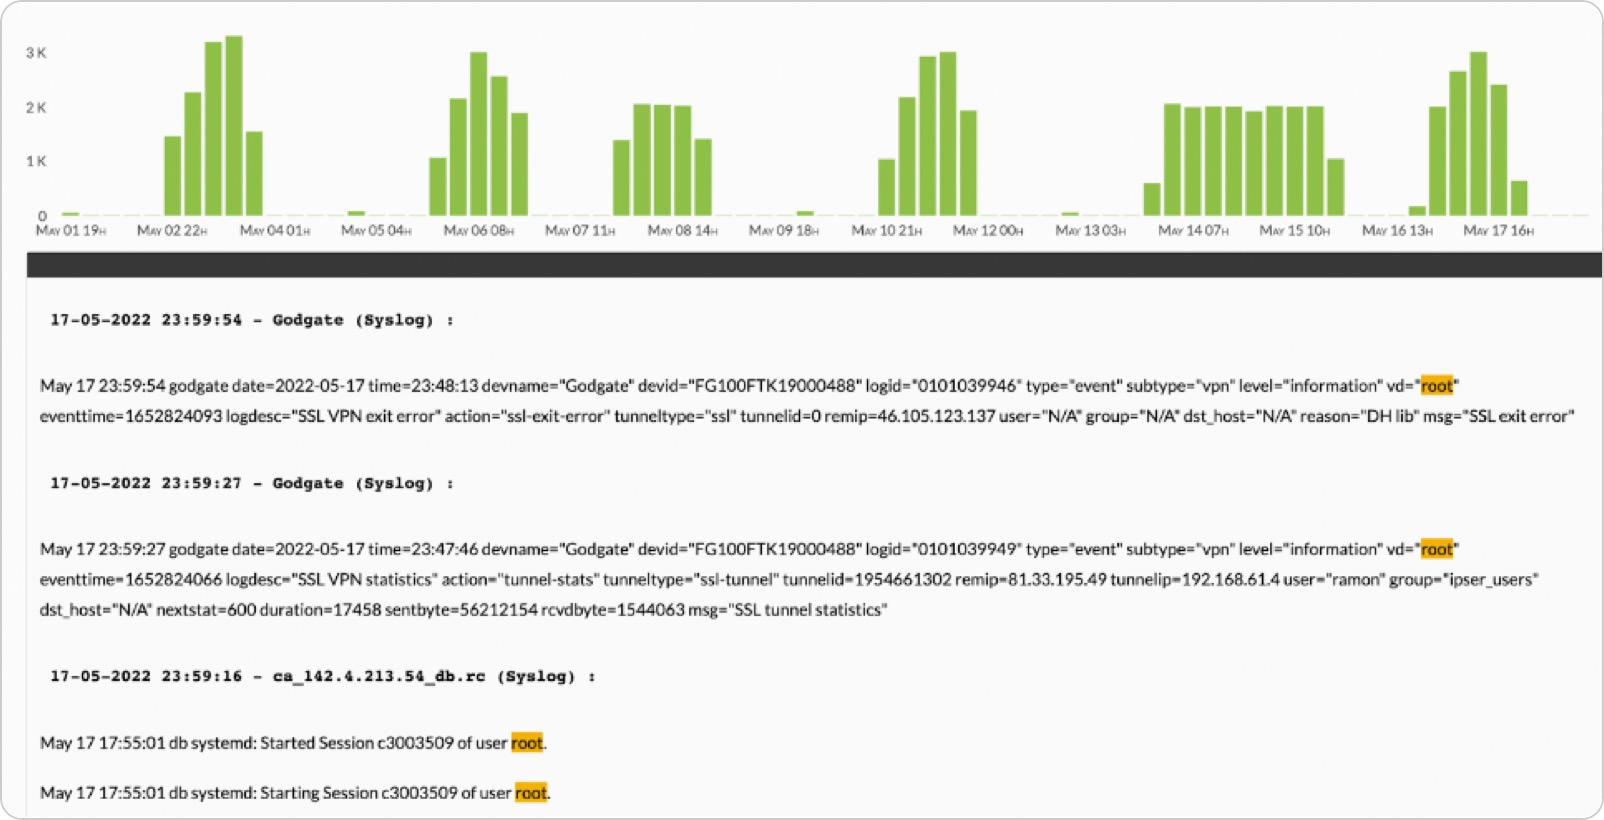
Log collection
Pandora FMS can collect logs from any source that supports syslog or through software agents (Windows and Linux). Such logs can be plain text files, or Windows system events.
They will be collected by Pandora FMS monitoring agent and sent to the server along with the monitoring data. So if you already have agents installed, you may collect logs from those systems conveniently and quickly, and without additional software or licenses.
Unlike monitoring data that is stored in a conventional SQL database, logs are stored in a separate Elastic system. You will be able to store gigabytes worth of logs and keep them for a long time (you will only need more disk space). You may set up alerts or search through your data sources. It is the ideal complement to comprehensive monitoring, and fully integrated into the console.
↑ Go to index
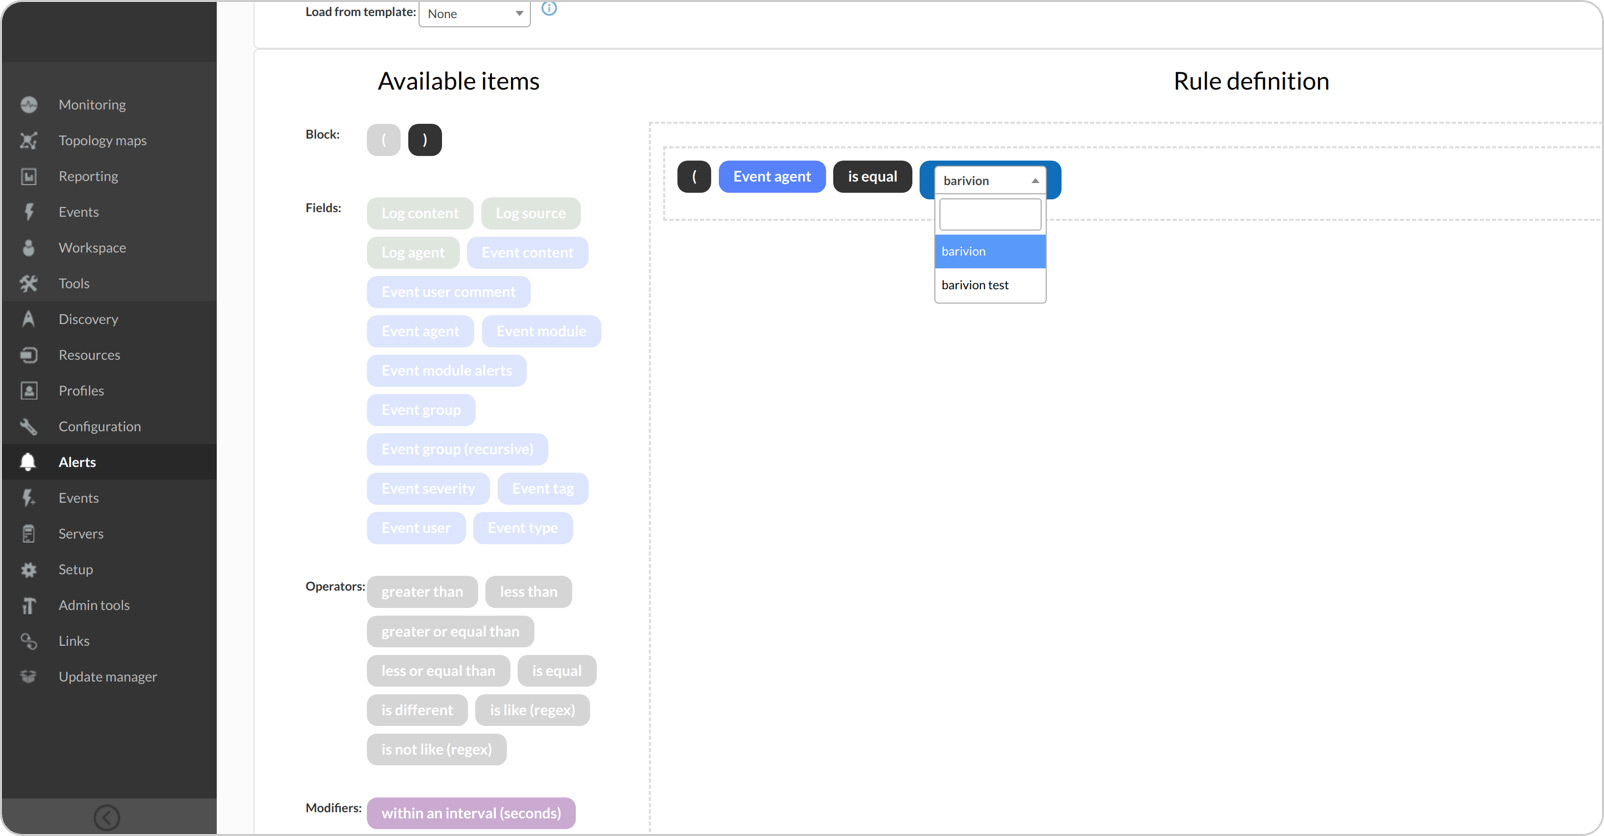
Inventory Alerts
PFMS inventory allows you to obtain data of many types: installed software packages, users with access to the equipment, installed patches, hardware devices, firmware and version of the base system, license or serial number, etc.
Alerts allow you to generate actions in case of finding or not finding certain data on a computer with inventory information (whitelist / blacklist).
For example, what if you know that there is a vulnerable version in your systems? Well, you could create an alert that notifies you if someone is using it. Or on the contrary, if you need an application installed on all your systems and someone does not install it, you may find out in real time.
↑ Go to index
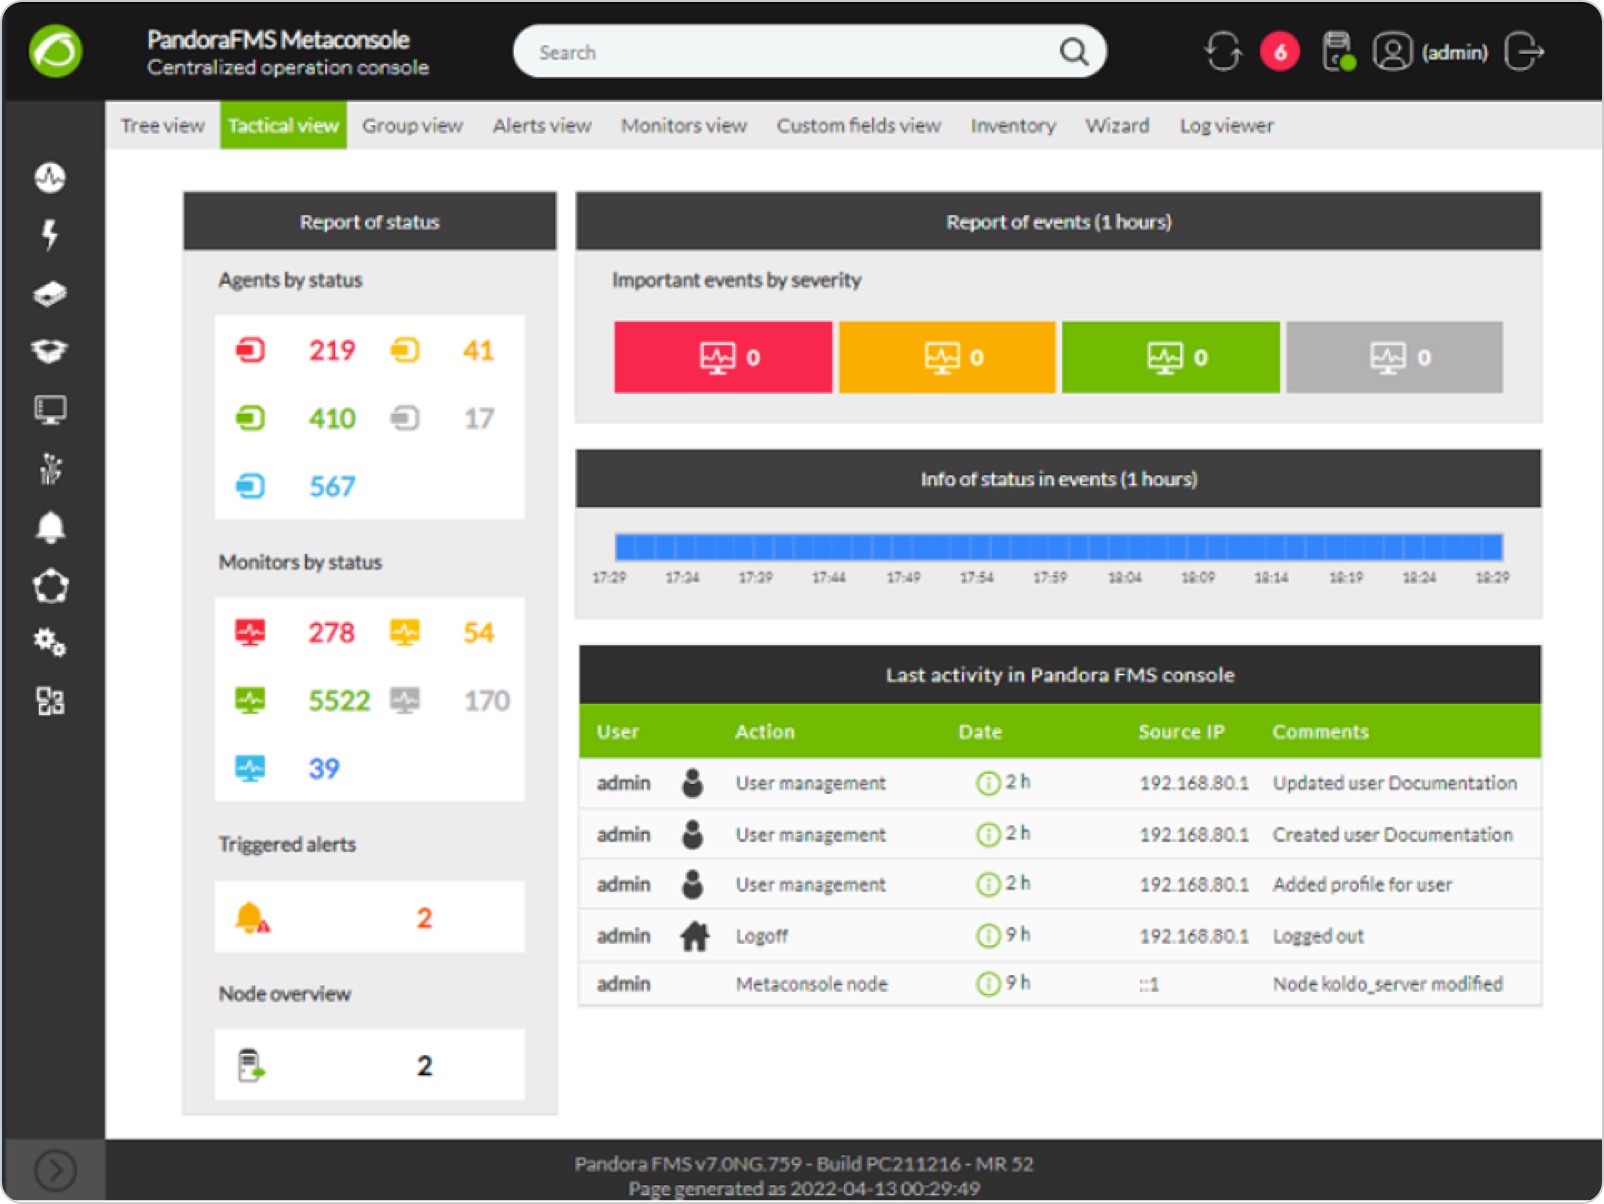
Metaconsole / Command Center
The Command Center is the jewel in the crown of Pandora FMS.
It serves the purpose of centrally controlling an unlimited number of independent Pandora FMS instances (each with its server, its console and its databases) so that you may manage dozens of thousands of agents from a single point, while these systems are in turn managed by independent instances.

This federated management system ensures uniformity and ease of management. It is a robust system where one system failing does not affect the rest of the systems, and where growth is fully horizontal and distributes loads automatically.
We have clients with more than 40,000 agents and more than one million metrics collected.
↑ Go to index
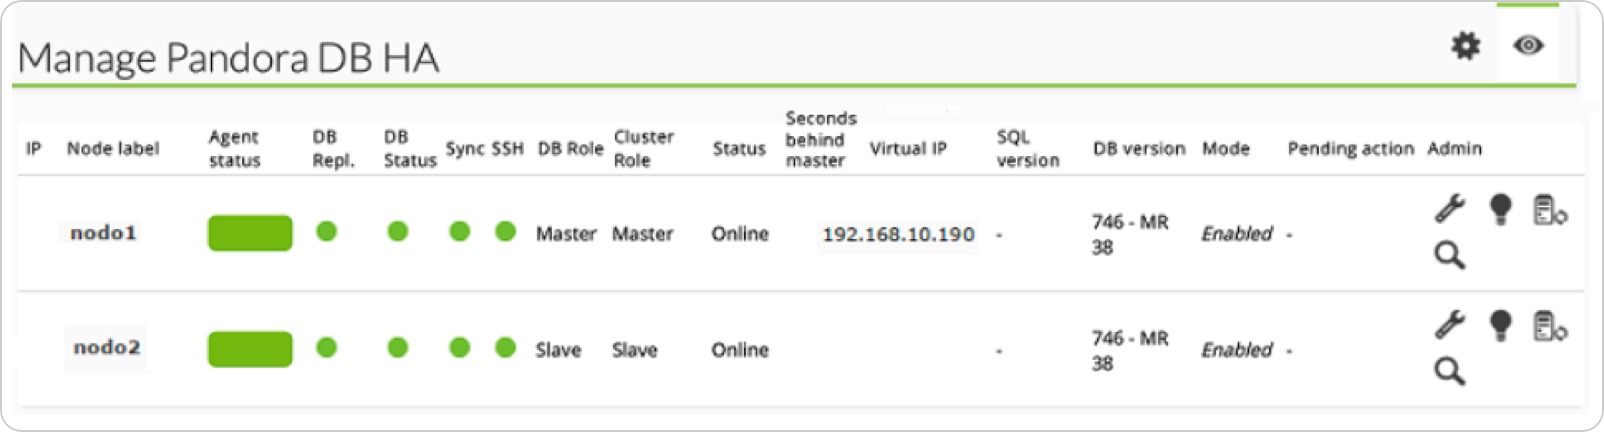
High Availability (HA)
In critical environments and/or with lots of load, it is possible that it is necessary to distribute the load among several machines and make sure that if any Pandora FMS component fails, the system will stay online.
PFMS has been designed to be modular but it is also designed to work collaboratively with other components and to be able to take on the burden of those that failed. The most critical component is the database (MySQL/Percona) that can be configured in Active/Passive mode so that in case of failure, a read-only node is automatically activated and the system continues to operate without pause, and without data loss.
This system is integrated into Pandora FMS console.
↑ Go to index
Discovery Cloud
Discovery Cloud allows, through a fully pre-installed and centralized system, to configure native connectors (through APIs) with the most widespread public cloud providers: Amazon, Azure and Google.
You will be able to get it hooked onto your instances and explore the resources available for monitoring: machines, disks, databases and other elements.
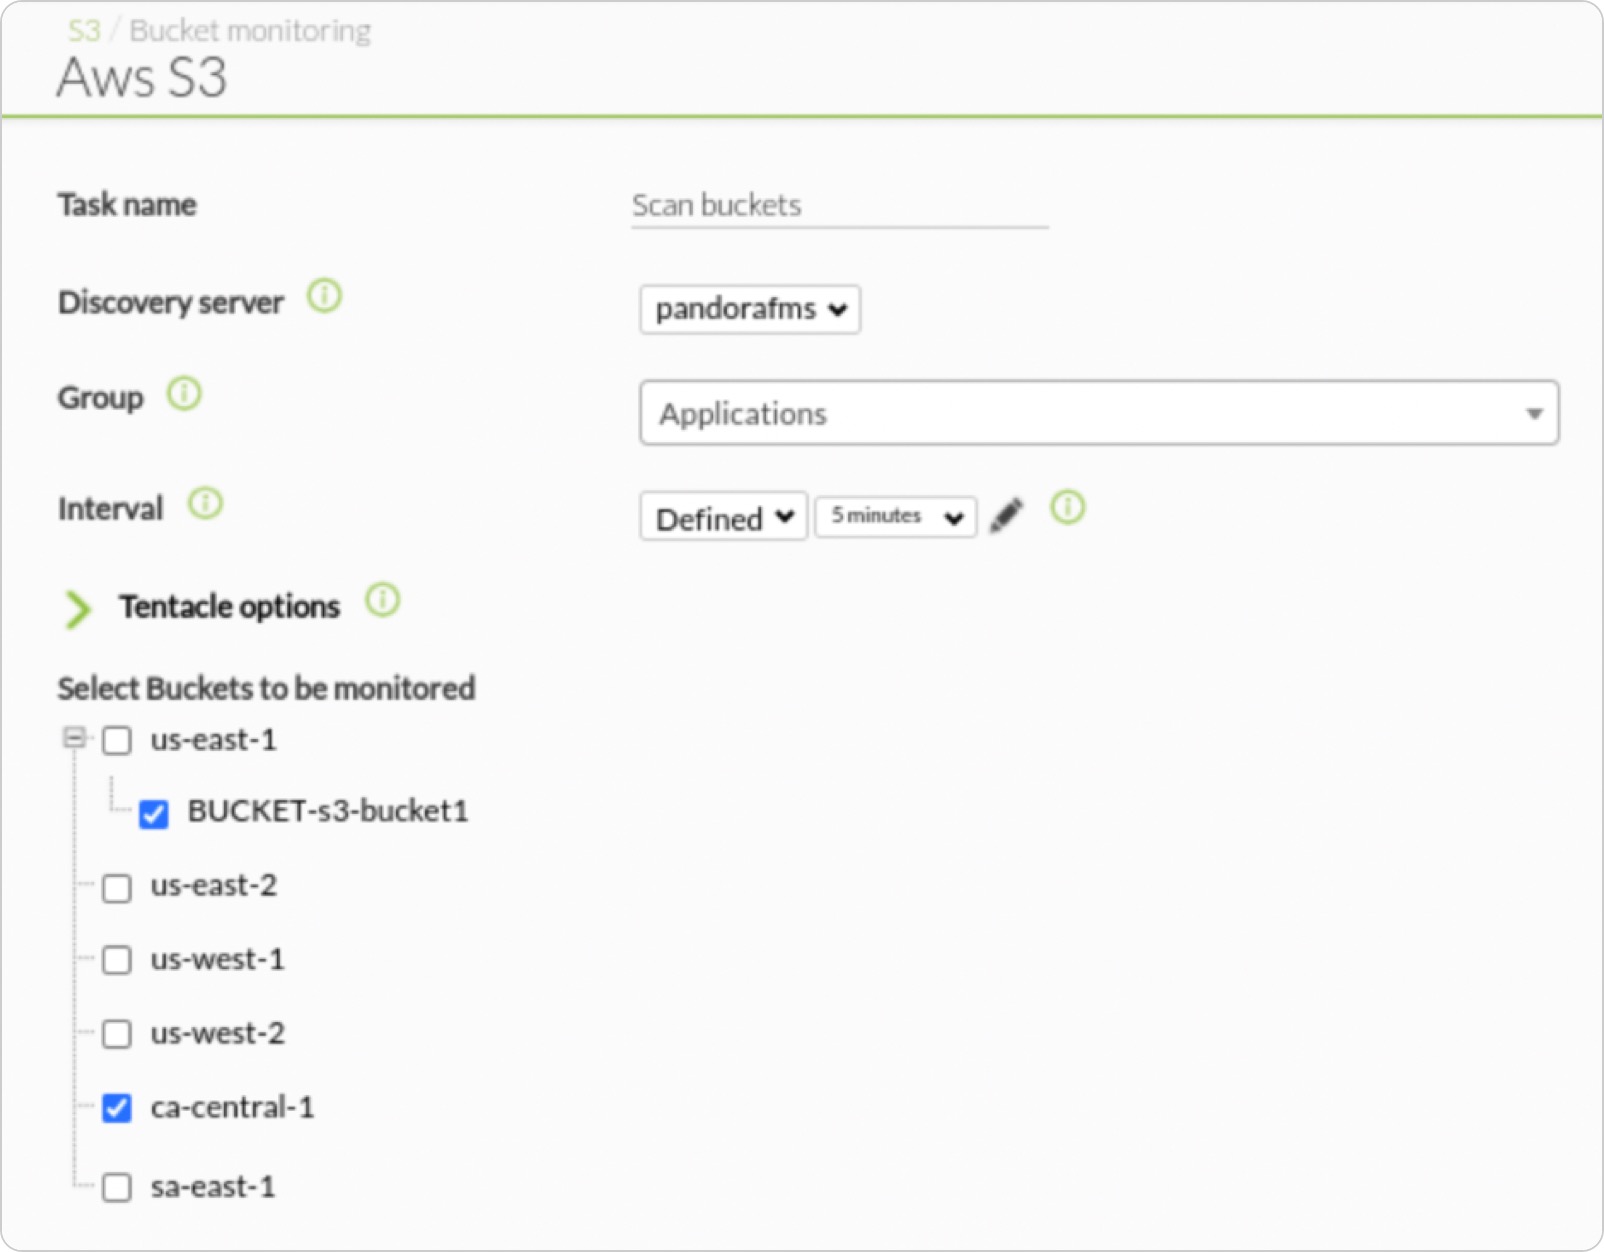
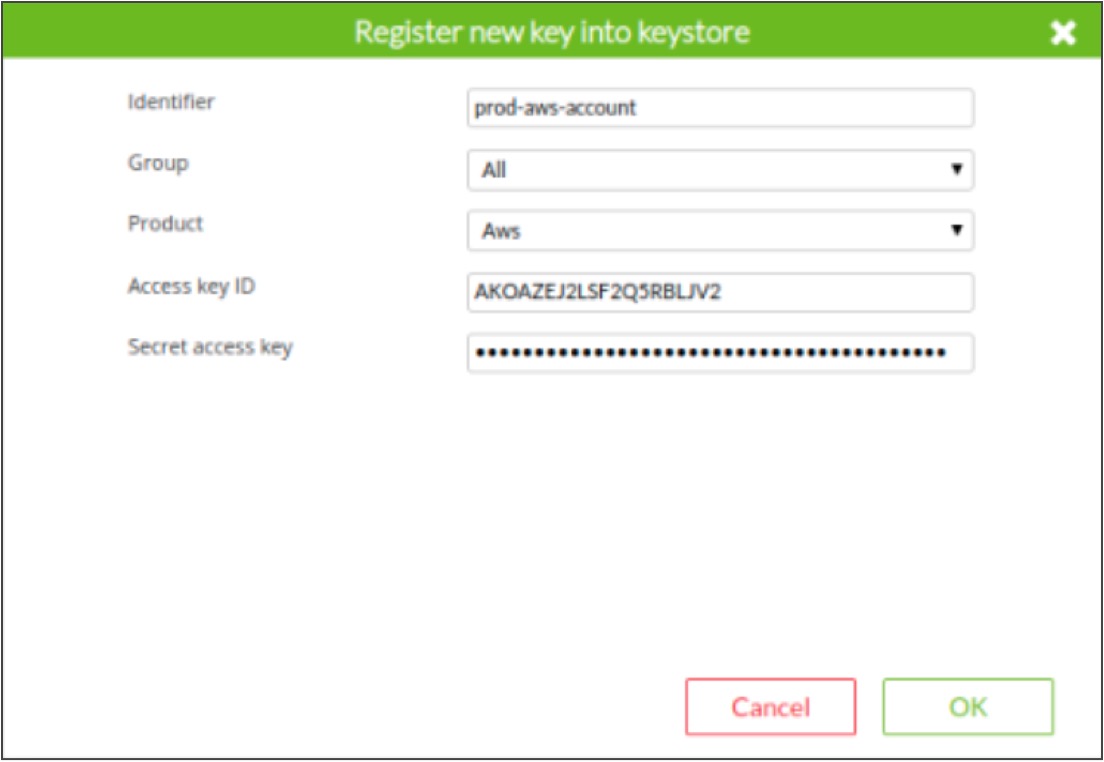
The advantage of this system is that you may get information about the services dynamically, without installing agents. In addition, if you later install agents, you may add both monitoring approaches. Through the credential container system you may even monitor different Amazon instances, for example.
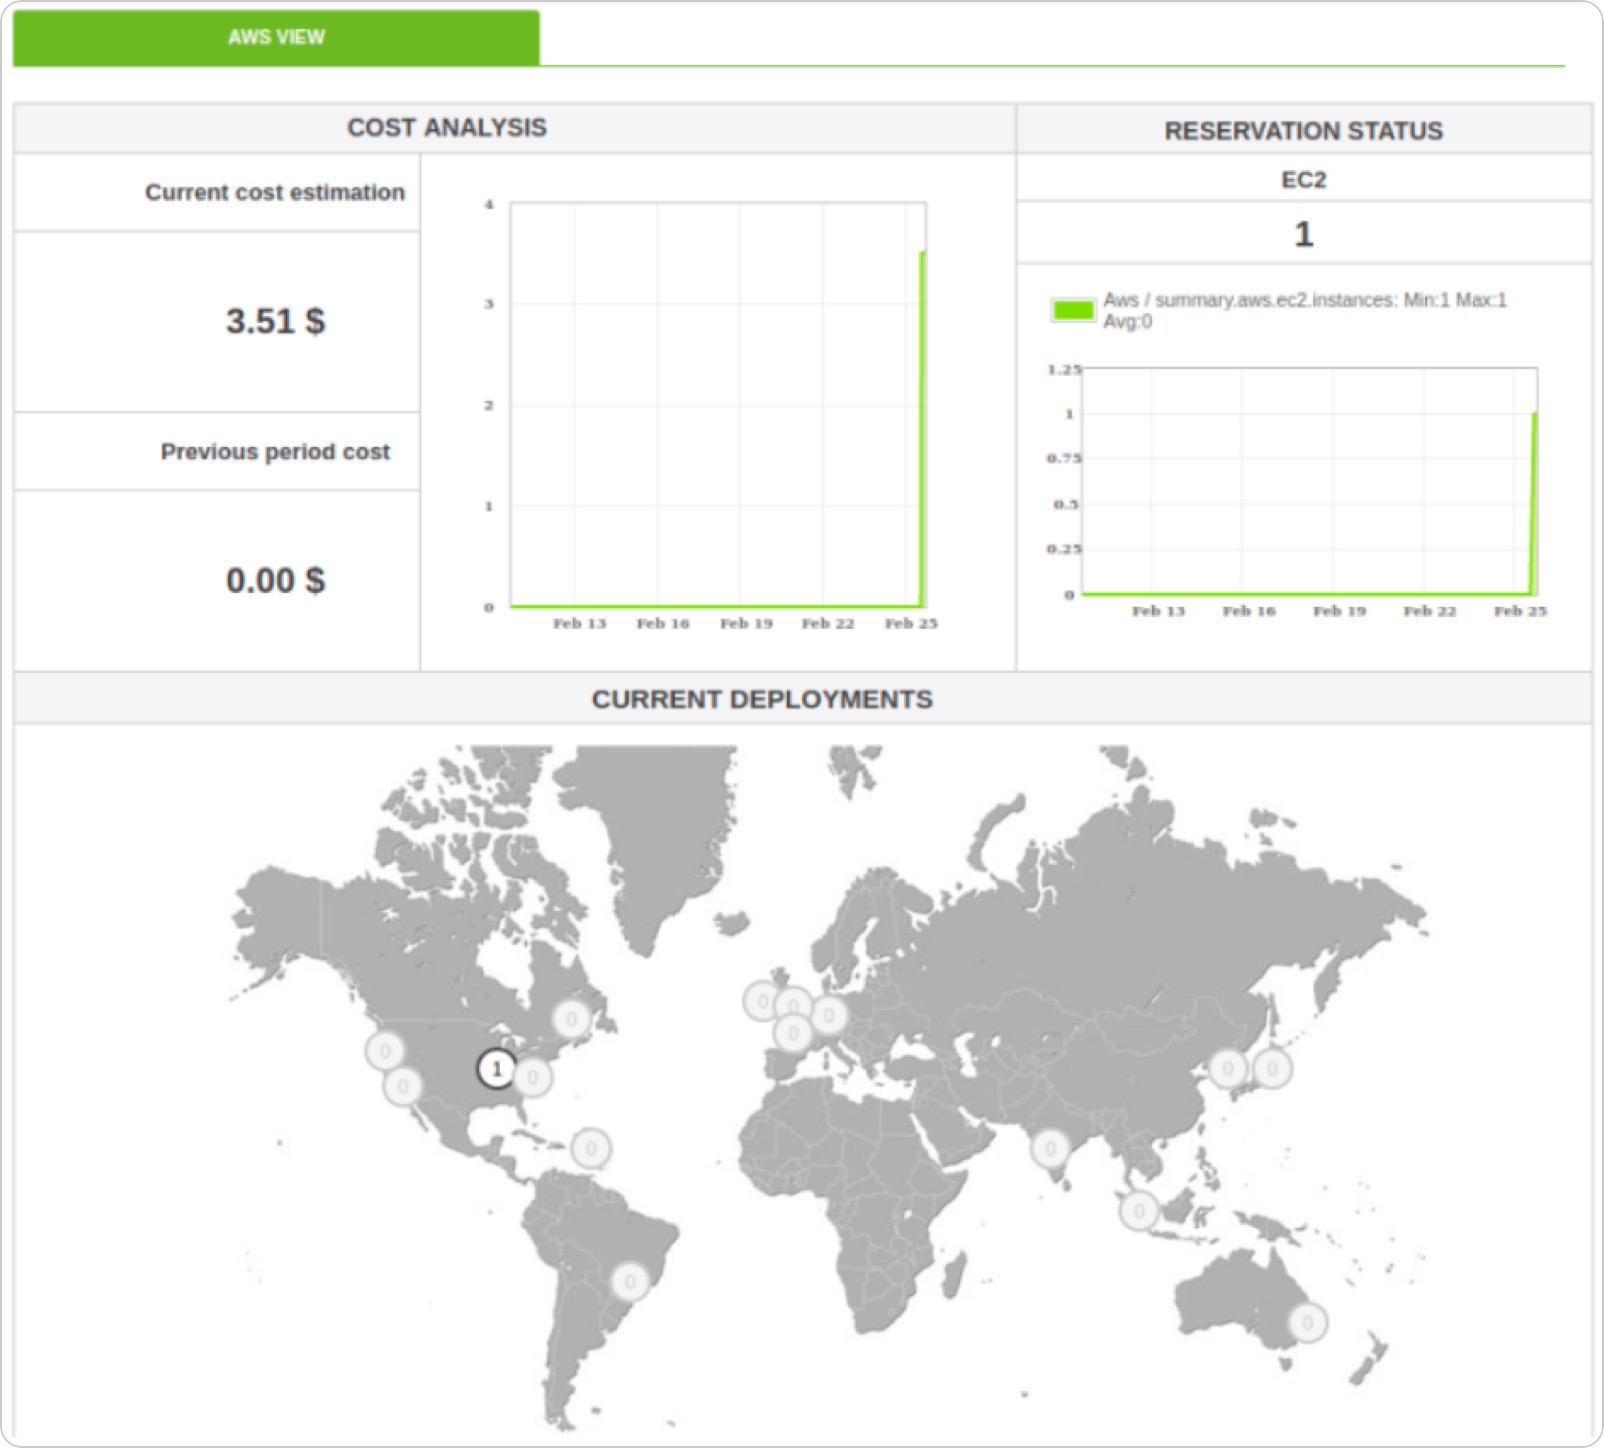
In the case of Amazon, you will also be able to find out the cost of active services.
↑ Go to index
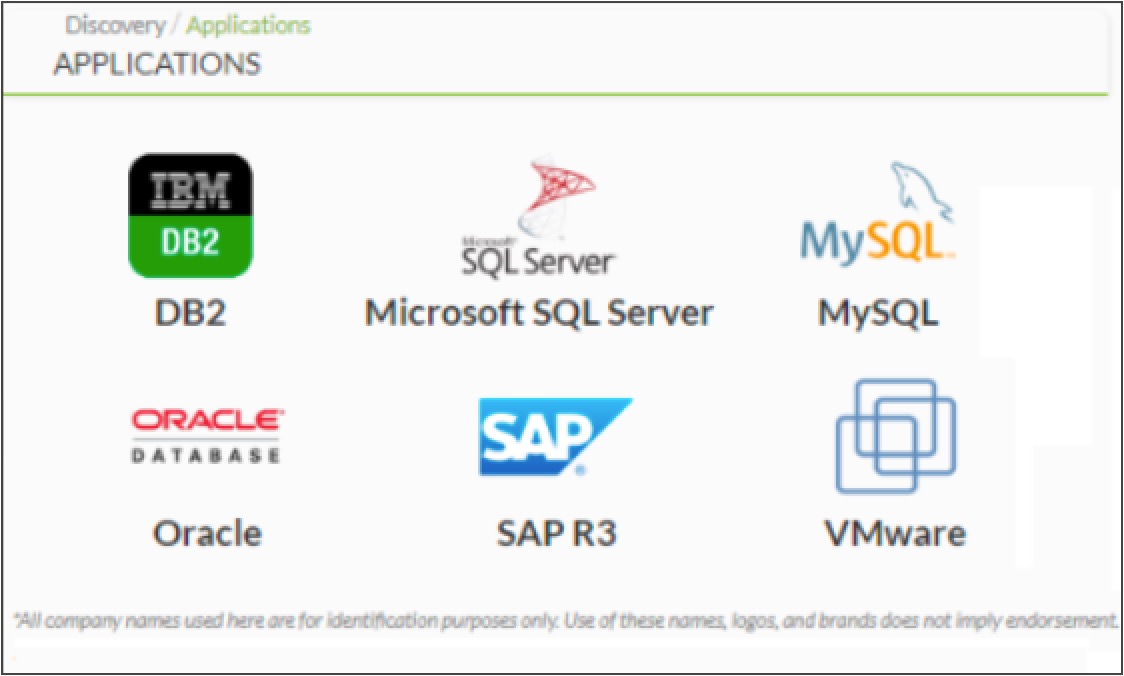
Discovery Applications
As with cloud providers, Discovery allows out-of-the-box to monitor some extended technologies centrally and remotely: Oracle, SAP R3, DB2, SQL Server, and VmWare virtualization (through the vCenter API).
↑ Go to index
Enterprise ACL’s
Along with OEM features, it allows you to customize not only the look, but the feature accessible by all types of users (including administrators). That way you may limit the functions of a PFMS instance, even making the menus disappear.
↑ Go to index
Comparison table Open Source vs Enterprise
| Features |
Open source |
Enterprise |
| Tech support |
In community forums, by volunteers
|
Worldwide hourly coverage. 24×7 optional |
| Professional services |
 |
 |
| Professional certification |
|
Several levels |
| Operating model |
on-premise |
on-premise
SaaS (MaaS)
|
| Remote monitoring SNMP, WMI and with plugins |
|
|
| Monitoring with agents |
|
|
| Reports, dashboards and visual consoles |
|
|
| Alerts system |
|
|
| Multi-user and multi-tenant |
|
|
| Netflow |
|
|
| Network Configuration Manager |
|
|
| IPAM |
(764 version) |
|
| Mobile Console APPs
|
|
|
| High Availability
|
(Manual) |
(Integrated) |
| Distributed Servers (Satellite)
|
|
|
| Policies
|
|
|
| Services
|
|
|
| AD Authentication
|
|
|
| Historical DB
|
|
|
| Remote control
|
Only SaaS |
SaaS and On-premise |
| Transactional monitoring of user experience (UX)
|
|
|
| IT Service Manager
|
Partial |
|
| Remote agent deployment
|
|
|
| Omnishell
|
|
|
| Agent autoconfiguration / autoprovisioning
|
|
|
| Command center (Metaconsole)
|
|
|
| Collections
|
|
|
| HA
|
|
|
| Correlated alerts
|
|
|
| Inventory alerts
|
|
|
| Log collection
|
|
|
| Discovery Cloud
|
|
|
| Discovery Applications
|
|
|
| Enterprise ACL’s
|
|
|
| OEM and Partial Customization
|
Partial |
|