


OpenTelemetry
Please check out our first article on observability to gain a fuller context for the topic we’re about to discuss. OpenTelemetry is currently the most actively developed standard in the field of observability. It is being adopted as the Cloud Native Computing Foundation incubating project. Born primarily as a merging of former OpenTracing and OpenCensus standards, OpenTelemetry continues to gain popularity, with its supporters including representatives of Google, Microsoft, and Uber.
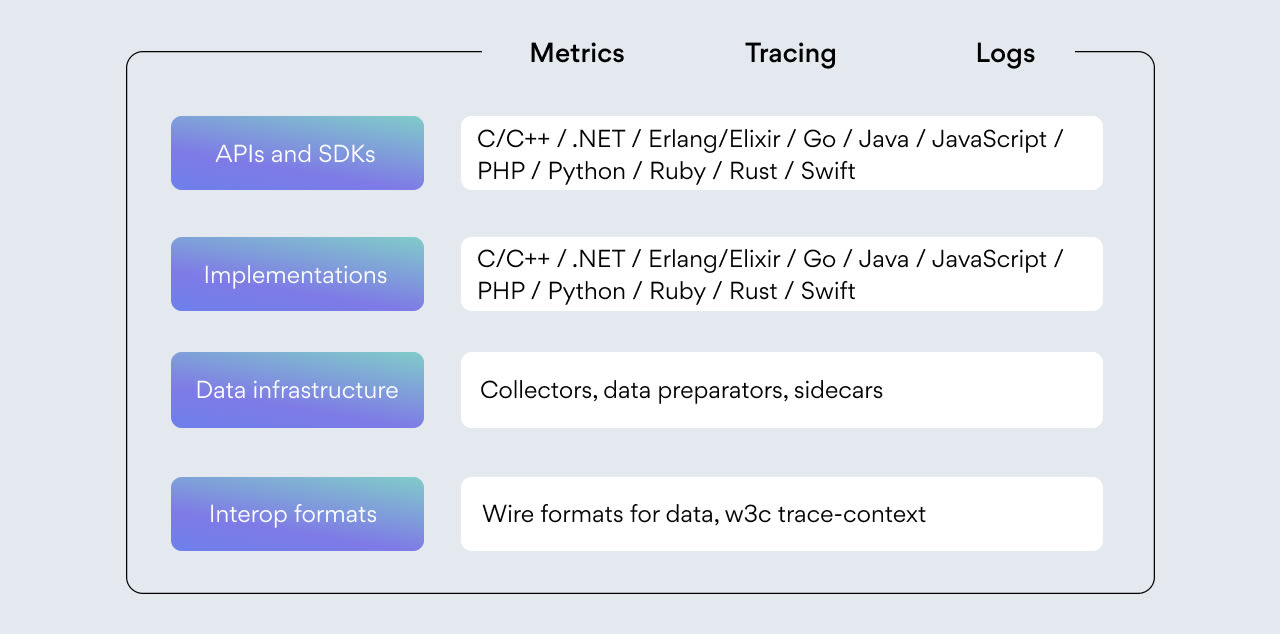
The goal of the OpenTelemetry project is to introduce a standardized open solution for any development team to enable a proper observability layer in its project. OpenTelemetry provides a standard protocol description for metrics, tracing, and logging collection. It also collects APIs under its nest instrumentation for different target languages and data infrastructure components.
Below is a visualization of the overall scope of OpenTelemetry (credits to CNCF):

The development of specifications and all related implementations is being run in an open way in Github, so anyone involved can propose changes.
Different instrumentation implementations for different languages are in development. The current state of readiness can always be found on a related page of official documentation (for example, PHP).
Logs

Logs are the oldest and best-known type of telemetry signals, and they have a significant legacy. Log collection and storage is a well-understood task, with many solutions being established and widely adopted to carry it out. For example, the infamous ELK (or EFK) stack, Splunk, and Grafana Labs recently introduced the Loki project, a lighter alternative to ElasticSearch.
The main problem is that logs are not integrated with other telemetry signals – no solutions offer an option to correlate a log record with a relative metric or trace. Having the opportunity to do this can form a very powerful introspection framework.
OpenTelemetry specifications try to solve this problem with a logging format standard proposal. It allows correlating logs via execution context metadata, timing, or a log emitter source.
However, right now the standard is at an experimental stage and under heavy development, so we won’t focus on it here. The current specifications can be found here.
Metrics
As discussed previously, metrics are numeric data aggregates representing the software system’s performance. Through aggregation, we can develop a combination of measurements into exact statistics during a time window.
The OpenTelemetry metrics system is flexible. It was designed to be like this to cover the existing metric systems without any loss of functionality. As a result, a move to OpenTelemetry is less painful than other alternatives.
The OpenTelemetry standard defines three metrics models:
Event model — metric creation by a developer on the application level.
Stream model — metric transportation.
Time Series model — metric storage.
The metrics standard defines three metric transformations that can happen in between the Event and Stream models:
Temporal reaggregation reduces the number of high frequency metrics being transmitted by changing the resolution of the data.
Spatial reaggregation reduces the number of high frequency metrics being transmitted by removing some unwanted attributes and data.
Delta-to-cumulative reduces the size of high frequency metrics being transmitted via a move from absolute numbers (cumulative) to changes between different values (delta).
We will talk about the Stream and Time Series models in the third part of our blog series, where we will discuss signal transportation and storage. For now, let’s focus on the Event model, which is related to instrumentation.

The process of creation for every metric in OpenTelemetry consists of three steps:
Creation of instruments that will generate measurements – particular data points that we evaluate.
Aggregation of measurements into a View – a representation of a metric to output from the instrumented software system.
Metric output – the transportation metrics to storage using a push or pull model.
The OpenTelemetry measurements model defines six types:
Counter – non-negative, continually increasing monotonic measurement that receives increments. For example, it may be a good fit for counting the overall number of requests the system has processed.
UpDownCounter – the same as the Counter, but non-monotonic, allowing negative values. It may be a good fit for reporting the amount of requests being currently processed by the system.
Histogram – multiple statistically relevant values distributed among a list of predefined buckets. For example, we may be interested not in particular response time but in the percentile of response time distribution, it falls into (a Histogram would be useful here).
Asynchronous Counter – the same as the Counter, but values are emitted via a registered callback function, not a synchronous function call.
Asynchronous UpDownCounter – the same as the UpDownCounter, but values are emitted via a registered callback function, not a synchronous function call.
Asynchronous Gauge – a specific type for values that should be reported as is, not summed. For example, it may be a good fit for reporting the usage of multiple CPU cores – in this case, you will likely want to have the maximum (or average) CPU usage, not summed usage.
Through Aggregations in OpenTelemetry, measurements are being aggregated into end metric values that afterward will be transported to storage. OpenTelemetry defines the following measurements as Aggregations:
Drop – full ignore of all measurements.
Sum – a sum of measurements.
Last Value – only the last measurement value.
Explicit Bucket Histogram – a collection of measurements into buckets with explicitly predefined bounds.
Exponential Histogram (optional) – the same as the Explicit Bucket Histogram but with an exponential formula defining bucket bounds.
A developer can define their own aggregations, but in most cases, the default ones predefined for each type of measurement will suit the developer’s needs.
After all aggregations have been done, additional filtering or customization can be carried out on the View level. To summarize, an example of a simple metric creation is the following (in GoLang):
import “go.opentelemetry.io/otel/metric/instrument”
counter := Meter.SyncInt64().Counter(
“test.counter”,
instrument.WithUnit(“1”),
instrument.WithDescription(“Test Counter”),
)
// Synchronously increment the counter.
counter.Add(ctx, 1, attribute.String(“attribute_name”, “attribute_value”))
Here we create a simple metric consisting of one counter-measurement. As you can see, many details we discussed are hidden but can be exposed if the developer needs them.
In the next part of our blog series, we will talk about metrics transportation, storage, and visualization.
Traces and spans
As we discussed previously, traces represent an execution path inside a software system. The execution path itself is a series of operations. A unit of operation is represented in the form of a span. A span has a start time, duration, an operation name, and additional context attached to it. Spans are interconnected via context propagation and can be nested (one operation can consist of multiple smaller operations inside itself). The resulting hierarchical tree structure of spans represents the trace – an entire execution path inside a software system.
The internal span structure can be visualized like this:

Here is an example of the simplest span creation (in GoLang):
import “go.opentelemetry.io/otel/trace”
var tracer = otel.Tracer(“test_app”)
// Create a span
ctx, span := tracer.Start(ctx, “test-operation-name”,
trace.WithSpanKind(trace.SpanKindServer))
testOperation()
// Add attributes
if span.IsRecording() {
span.SetAttributes(
attribute.Int64(“test.key1”, 1),
attribute.String(“test.key2″,”2”),
)
}
// End the span
span.End()
Now we have our first trace.

A trace can be distributed through different software microservices. In this case, so as not to lose the interconnection, OpenTelemetry SDK can automatically propagate context through the network according to the protocol being used. One example is the W3C Trace Context HTTP headers definition. However, not all language SDKs support automatic context propagation, so you may have to instrument it manually depending on the language you use.
Detailed documentation about traces with format explanations can be found here.
Signal interconnections
The ability to interconnect different types of signals makes an observability framework powerful. For example, it allows you to identify a service response that took too long via metrics and, in one click, jump to the correlating trace of this response execution to identify what part of the system caused the slow processing.
Signals in OpenTelemetry can be interconnected in a couple of ways. One is the use of Exemplars – specific values supplied with trace, logs, and metrics. These consist of a particular record ID, time of observation, and optional filtered attributes specifically dedicated to allowing a direct connection between traces and metrics. Detailed documentation about Exemplars can be found here.
Another approach to signal interconnection is the association of the same metadata with the use of Baggage and Context. Baggage is a specific value supplied with traces, logs, and metrics that allows you to annotate it and consists of user-defined pairs of keys and values. By annotating corresponding metrics and traces with the same values in Baggage, the user can correlate them. Detailed documentation about Baggage can be found here.
Conclusion
We covered the pillars of OpenTelemetry and some details of application instrumentation. But we don’t just need to instrument our applications – we should also introduce tooling for the aggregation, storage, and visualization of the signals we supply. In the third part of this series, we will discuss tooling and the OpenTelemetry collector component in detail.
