Skip to content

GLPI: IT service management and its integration with Pandora FMS

GLPI is a free IT Service Management (ITSM) solution that allows you to manage assets, incidents and requests within an organization. It works as an incident tracking and service desk system, optimizing technical support and technological resources.

It also includes hardware and software inventory, contracts and licenses, offering a centralized view of the whole infrastructure. Its intuitive web interface and customization options ensure flexibility and scalability for businesses of any size.


What does it bring to your company?

  • IT asset management.
  • Follow-up and troubleshooting.
  • Technical support optimization.
  • Scalability: adaptable to companies of any size.

GLPI is ideal for organizations looking to improve the management of their technology resources, automate processes and optimize IT service management.


All the advantages of GLPI together with Pandora FMS

GLPI has an integration in Pandora FMS that some customers are already enjoying.

With it you may automate ticket creation, for which you may use a plugin that you may find in the library . This plugin allows integrating Pandora alerting of ticket creation in your GLPI environment through the rest API available to the service.

Each time an alert is executed and triggers the plugin, it opens a ticket in GLPI with information about the module that triggered the alert: agent, module data, IP address, timestamp and description of the module, with a title for the ticket, category, assignment group and priority, which may vary depending on the alert action.

Running the plugin with its parameters, in a configurable time interval, allows you to automate the whole process of creating a ticket that would normally be performed by a user. It is necessary to use credentials to authenticate with your environment (username and password or a token, which must be generated beforehand). The plugin configuration allows you to specify a title, description, priority, category, group, type of query. In addition, it will check whether there is already a ticket created with these features so that in case it is already created, it is only necessary to add its corresponding follow-up.

The plugin makes use of a parameter called “–recovery” that sets two different paths in its execution. If used, the plugin will check the status of the specified ticket and if it is not closed add a comment on it, if it is closed, it will not do anything else. If it is not used, the performance will be the same, but it will change if the ticket is closed or does not exist. If closed, it will create a new ticket. If it does not exist, it will create the ticket if there is a computer with the same name as the agent specified with the “–agent_name” parameter.

The plugin does not need additional dependencies for its use, since these are already incorporated. But it is necessary for in the GLPI environment to have rest api enabled, since the plugin makes use of it for ticket creation.

For that, access, in your GLPI environment, Setup → General

The “Enable Rest API” option must be enabled.
From that menu you may also enable whether you want to be able to authenticate with credentials, with tokens or both.

Once done, it will be possible to use the plugin, for that, it will be necessary to configure an alert command. By creating alert commands, you may specify and automate ticket creation.

This can be done from the alerts menu, in commands:

Enter a name, group, and the command, using as values for the parameters the macro _fieldx _, where x is the number of the parameter (they do not distinguish any order, each macro just needs to have a different number).

Once configured, you may configure the macro value below in the description fields.


About Version 2 Digital

Version 2 Digital is one of the most dynamic IT companies in Asia. The company distributes a wide range of IT products across various areas including cyber security, cloud, data protection, end points, infrastructures, system monitoring, storage, networking, business productivity and communication products.

Through an extensive network of channels, point of sales, resellers, and partnership companies, Version 2 offers quality products and services which are highly acclaimed in the market. Its customers cover a wide spectrum which include Global 1000 enterprises, regional listed companies, different vertical industries, public utilities, Government, a vast number of successful SMEs, and consumers in various Asian cities.

About PandoraFMS
Pandora FMS is a flexible monitoring system, capable of monitoring devices, infrastructures, applications, services and business processes.
Of course, one of the things that Pandora FMS can control is the hard disks of your computers.

What is Grafana?

Grafana is an open source platform for real-time data display and monitoring. One of its functions is the creation of interactive and customizable dashboards that make metric analysis from several sources, such as databases, monitoring systems and cloud platforms.

Its flexibility and compatibility with multiple data providers make it an essential tool for observability and decision making in IT environments.

What advantages does it offer for your infrastructure?

  • Real-time monitoring of metrics and logs.
  • Support for multiple data sources, such as Prometheus, InfluxDB, MySQL, AWS CloudWatch, and more.
  • Customizable alerts and notifications for a proactive response.
  • Intuitive and highly customizable interface for effective visual analysis.
  • Scalability and extensibility through custom plugins and boards.
Grafana is perfect for organizations looking to improve the visibility of their systems, optimize monitoring, and make data-driven decision making easier.

Grafana integration with Pandora FMS

Grafana has an integration in Pandora FMS, which allows to merge both monitoring platforms. In order to use this integration, only a few minimum prerequisites are necessary:
  • API extension loaded in Pandora.
  • Access from Grafana to Pandora machine from which you will receive the data and which has the API Extension loaded.
  • Enable the plugin ID in the Grafana configuration file.
These configurations can be done quickly by following the steps below:

1. Add Pandora FMS Extension

First of all, start in your Pandora FMS console the extension that will allow you to obtain the data to be represented in Grafana dashboards. To that end, just download the ZIP package that you may find in your library and upload it to Pandora FMS console from the menu: Admin tools > Extension manager > Extension uploader: 
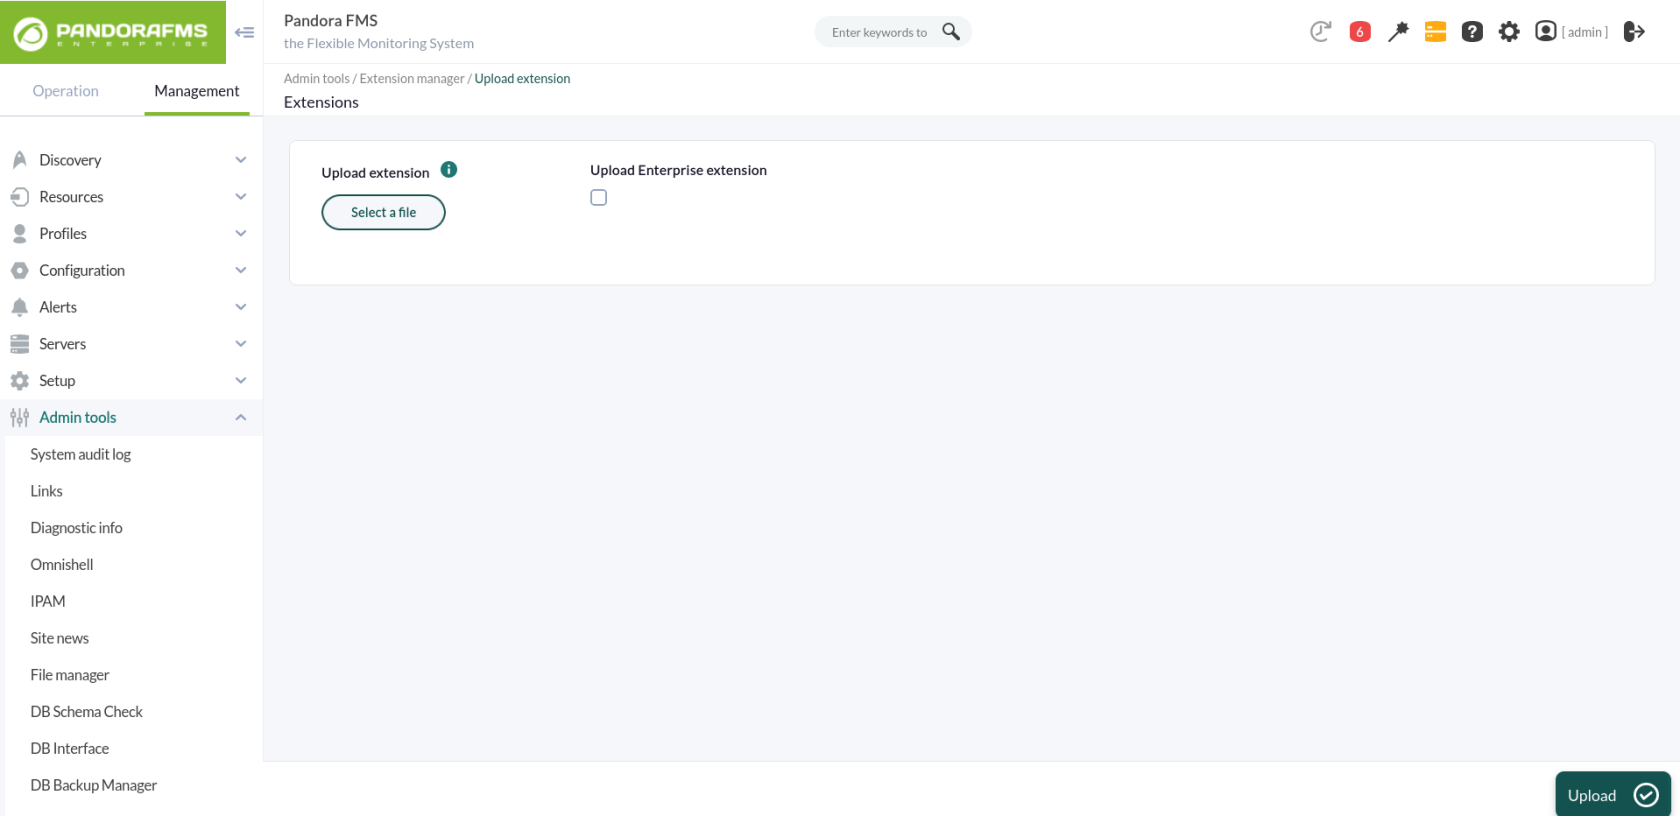
It is important not to check the “Upload enterprise extension” option. In short, these steps basically locate the contents of the ZIP file in the extensions directory of Pandora FMS console, which will lead to the directory being created: /var/www/html/pandora_console/extensions/grafana 
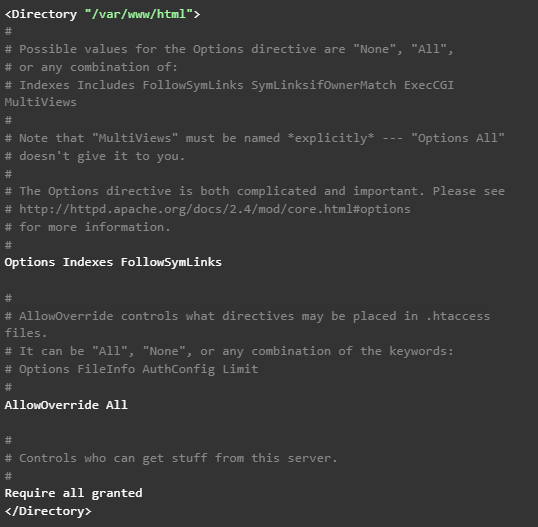
If, as in this case, the installation is based on a Pandora FMS ISO, it will also be necessary to modify a configuration parameter of the Apache server. Just edit the file /etc/httpd/conf/httpd.conf, and set the parameter “AllowOverride none” as “AllowOverride All”, within the directives of the block ‘’ since that is where Pandora FMS console is located. Therefore, it should be this way: Also add a parameter in the PHP settings. Add the following line at the end of the file /etc/php.ini: serialize_precision = -1 And for these changes to go into effect, the Apache service must be restarted:

2. Loading Pandora FMS plugin for Grafana

Upload the ZIP file to the Grafana server with all the plugin files and place it in the path “/var/lib/grafana/plugins”. Unzip the file on this path with the “unzip” command and restart the Grafana service to load it:

3. Configuring Pandora FMS as data source for Grafana dashboards

Add the following lines to the end of the Grafana configuration file (/etc/grafana/grafana.ini): 
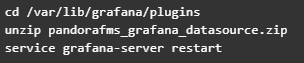
After this change is applied, the Grafana service must be restarted using the following command: service grafana-server restart At this point, what you have to do is configure the plugin uploaded in Grafana so that it connects to the extension loaded in Pandora FMS and allows you to use its data in Grafana dashboards. 
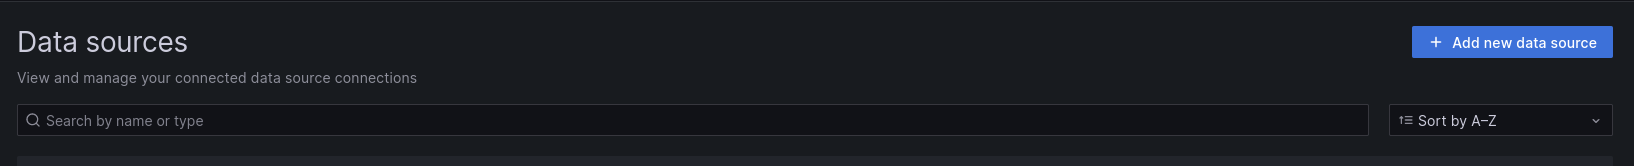
Access the “Configuration > Datasources” menu in Grafana and click on the “Add datasource” button: You will see different plugins that you may configure, and at the bottom of the list, you will see the plugin that you just loaded for Pandora FMS. Click on it: This will take you to a form where you only need to fill out 3 fields for the connection with the Pandora FMS extension:
  • URL to the extension, which according to the suggestion we will see will be (by default) “http://x.x.x.x/pandora_console/extensions/grafana”, where “xxxx” is the IP address or DNS name to your Pandora FMS console.
  • Pandora FMS user, which will allow you to obtain data for Grafana dashboards. This user must have at least agent read permissions (AR) and can only obtain data from those agents on which it has permissions.
  • Pandora FMS user password.
With these fields completed, you may click on “Save & Test ” to verify the operation of your new data source:

What happens if it does not work properly?

In configuration you might see different errors, such as:
  • HTTP Error Bad Gateway → If Grafana could not connect to Pandora FMS or if the indicated IP address was incorrect.
  • HTTP Error Not Found → If the indicated URL was not correct, for example because Pandora FMS extension was not correctly loaded or just because of an error when typing in the URL in the form.
  • Datasource connection error: Unauthorized → If the user and/or password indicated were not correct or if the user did not have the minimum agent read permissions (AR).

Create your first Dashboard in Grafana

First, go to the “Create > Dashboard” menu, and in the board that will appear, click “Add query”: 
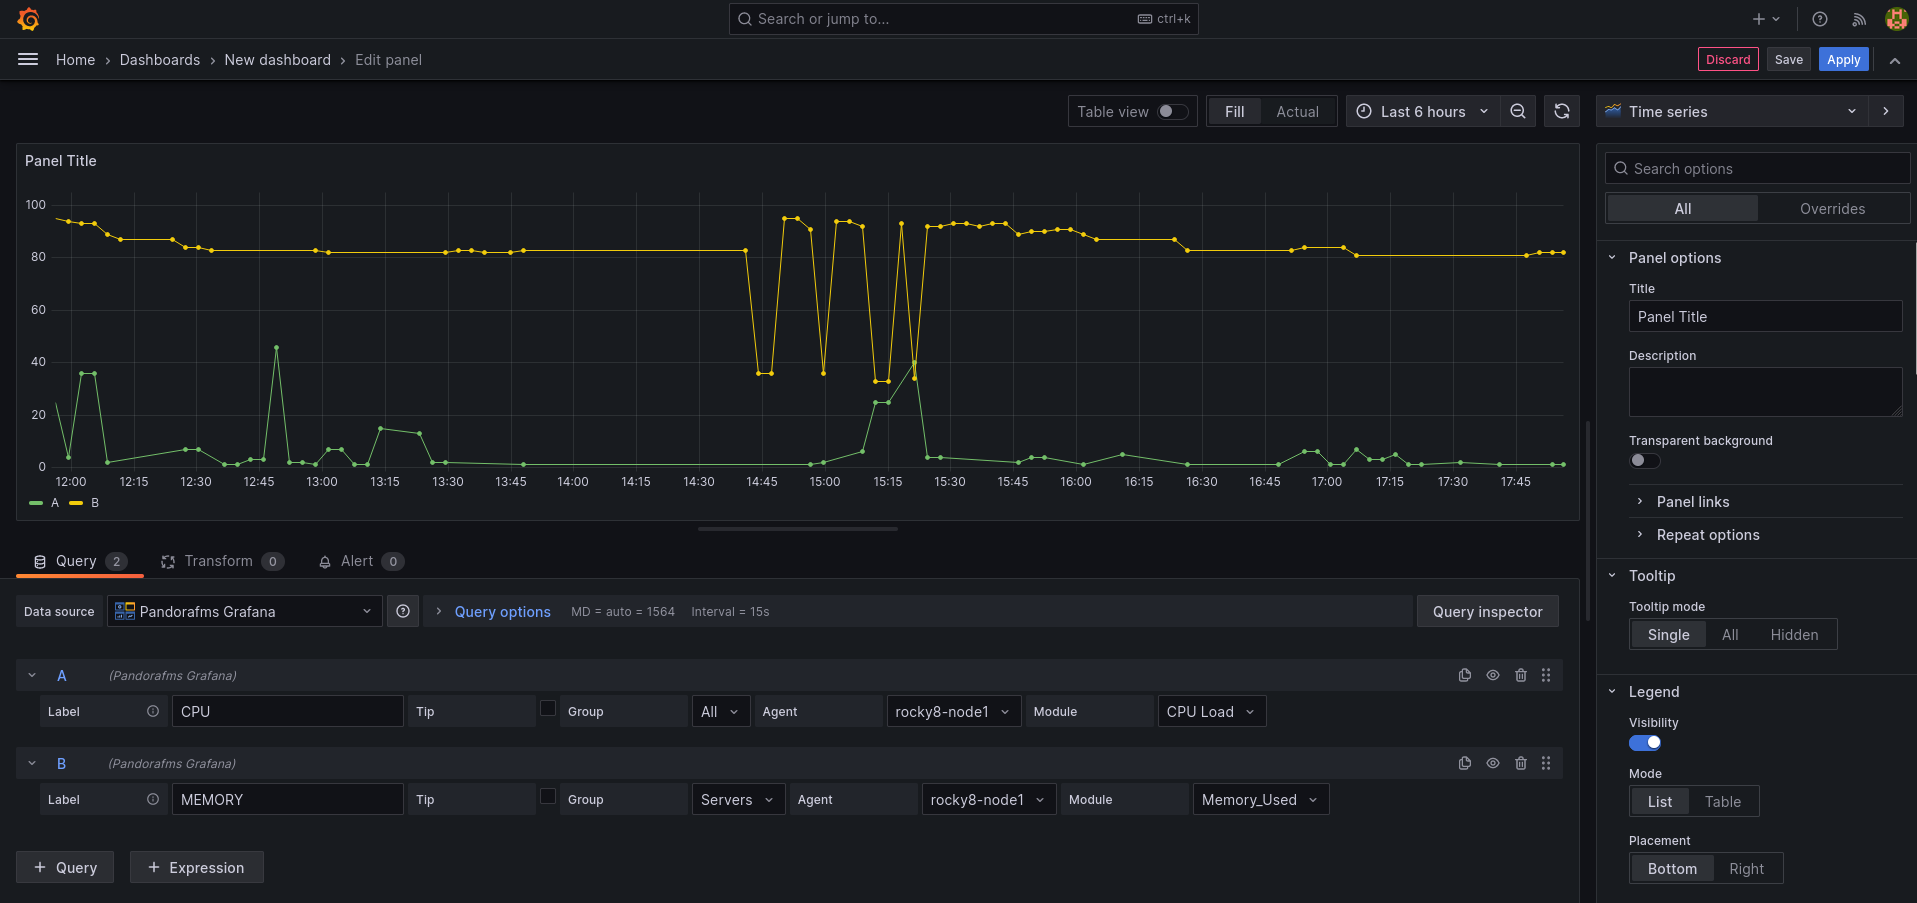
This will take you to a form where to choose your “Pandora FMS” data source in the “Query” drop-down. This will make the bottom of the form change and you will see a query to choose a module from which to display the data on the board:
  • Label: It will allow you to specify the tag that you wish for the data represented for this query to have.
  • Group: It is used to filter the agent about which to represent data. A group must be chosen.
  • Agent: It is used to filter the module about which to represent data. Some agent must be indicated.
  • Module: It is used to specify exactly the module about which to represent data.
  • TIP: It is a field that will allow to indicate whether the data to be represented will be compacted or not. If unchecked, the data will be compacted, which will result in easier-to-interpret and faster-loading graphs, although the data sample will not be the actual one but rather an average.
And once done, there you have your Pandora FMS data in Grafana. You may include more than one query in the same board, which allows you to compare data from different modules: 
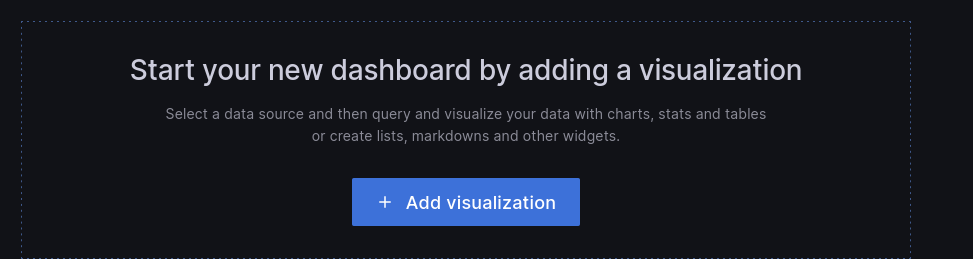
And you may also add more boards within the same Grafana dashboard, so that you have all the necessary information on the same screen.

Create your first alarm in Grafana

You may create an alert from the “Alert” menu, in the dashboard display (once the Dashboard is saved). 
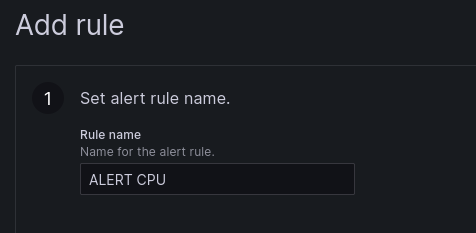
In this menu, adjust a few rules to configure your alert: 1 . Set the name of the alert rule. 
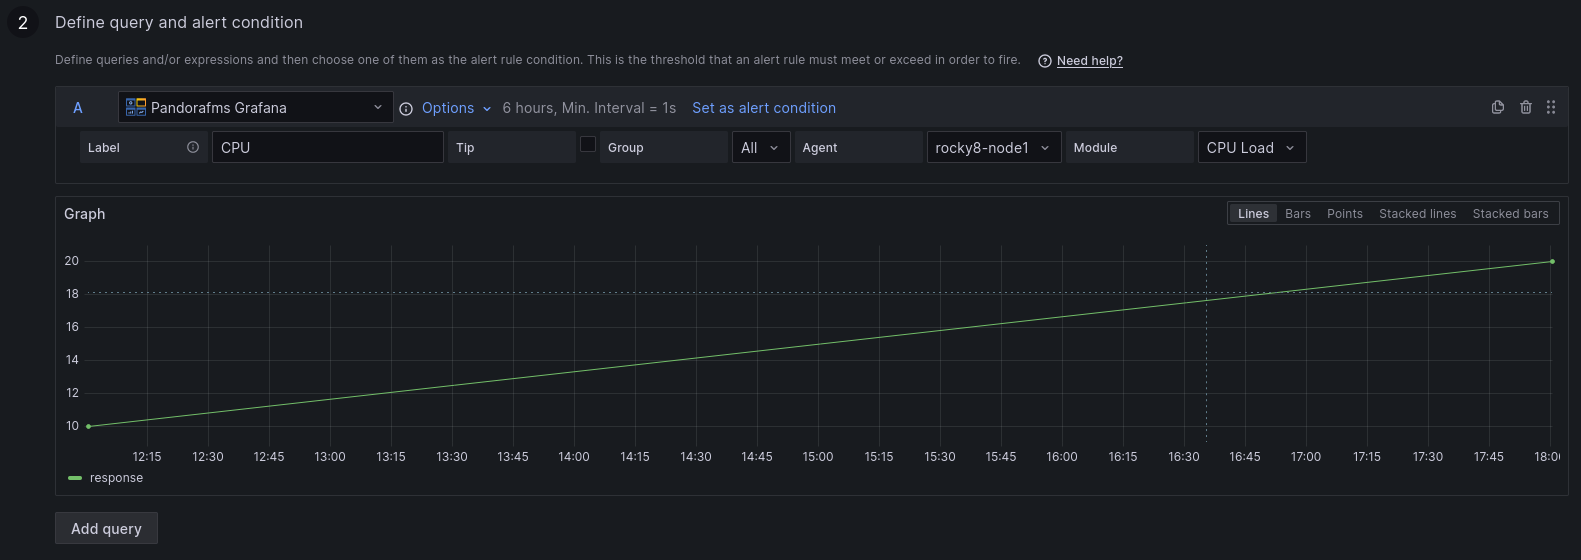
2. Define the query and the alert condition. 3. Establish alert evaluation behavior.
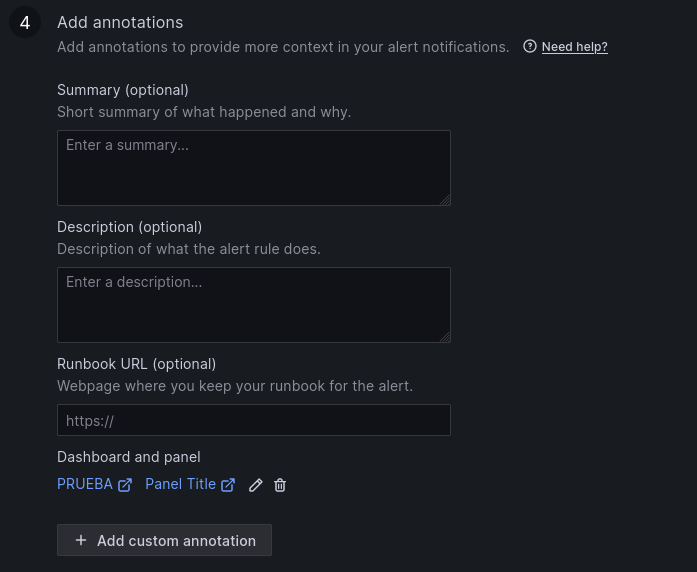
 4. Add notes. 5. Set up notifications. 
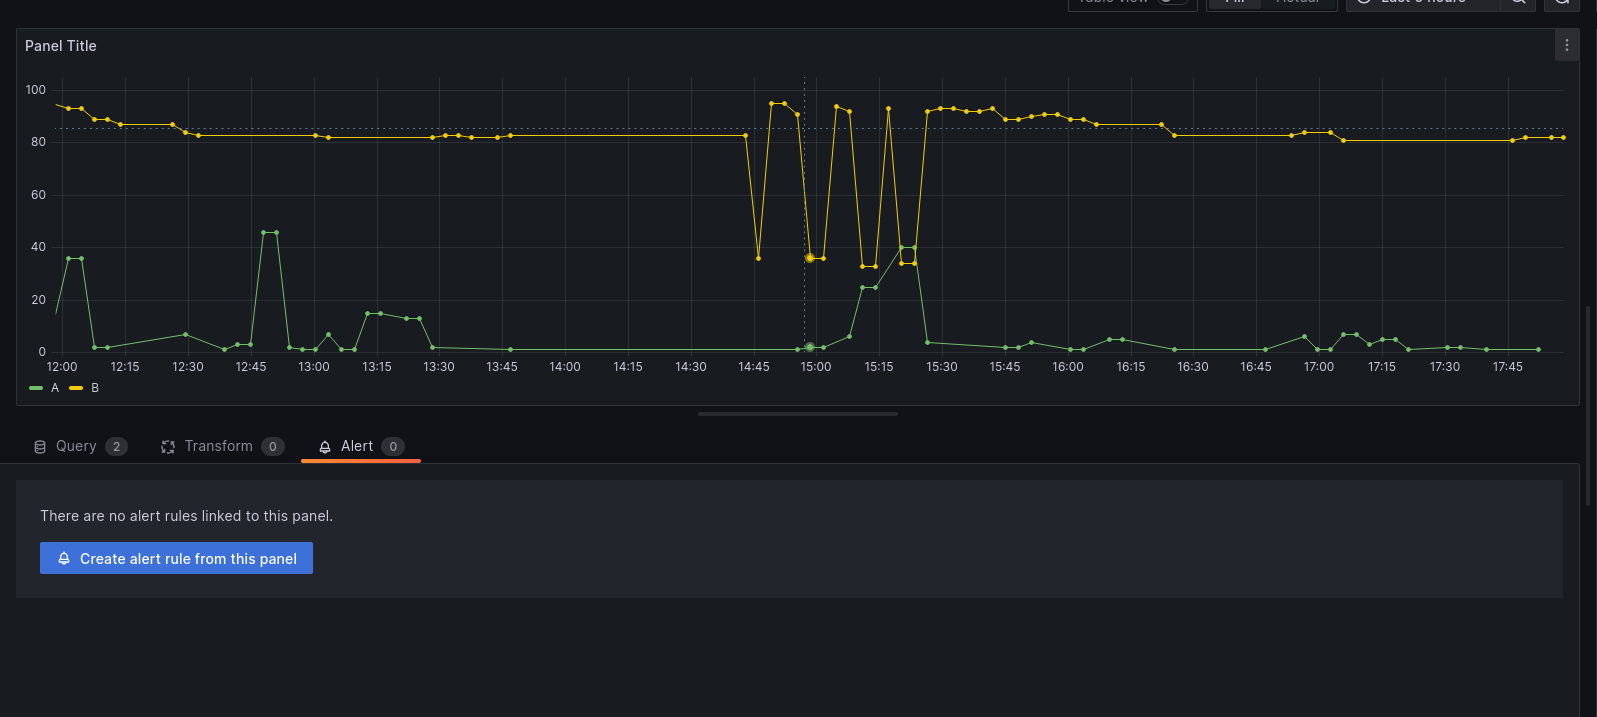
Once the alert is configured and saved, you may see it in the dashboard:


About Version 2 Digital

Version 2 Digital is one of the most dynamic IT companies in Asia. The company distributes a wide range of IT products across various areas including cyber security, cloud, data protection, end points, infrastructures, system monitoring, storage, networking, business productivity and communication products.

Through an extensive network of channels, point of sales, resellers, and partnership companies, Version 2 offers quality products and services which are highly acclaimed in the market. Its customers cover a wide spectrum which include Global 1000 enterprises, regional listed companies, different vertical industries, public utilities, Government, a vast number of successful SMEs, and consumers in various Asian cities.

About PandoraFMS
Pandora FMS is a flexible monitoring system, capable of monitoring devices, infrastructures, applications, services and business processes.
Of course, one of the things that Pandora FMS can control is the hard disks of your computers.

What is GLPI?

GLPI is a free IT Service Management (ITSM) solution that allows you to manage assets, incidents and requests within an organization. It works as an incident tracking and service desk system, optimizing technical support and technological resources.

It also includes hardware and software inventory, contracts and licenses, offering a centralized view of the whole infrastructure. Its intuitive web interface and customization options ensure flexibility and scalability for businesses of any size.


What does it bring to your company?

  • IT asset management.
  • Follow-up and troubleshooting.
  • Technical support optimization.
  • Scalability: adaptable to companies of any size.

GLPI is ideal for organizations looking to improve the management of their technology resources, automate processes and optimize IT service management.


All the advantages of GLPI together with Pandora FMS

GLPI has an integration in Pandora FMS that some customers are already enjoying.

With it you may automate ticket creation, for which you may use a plugin that you may find in the library . This plugin allows integrating Pandora alerting of ticket creation in your GLPI environment through the rest API available to the service.

Each time an alert is executed and triggers the plugin, it opens a ticket in GLPI with information about the module that triggered the alert: agent, module data, IP address, timestamp and description of the module, with a title for the ticket, category, assignment group and priority, which may vary depending on the alert action.

Running the plugin with its parameters, in a configurable time interval, allows you to automate the whole process of creating a ticket that would normally be performed by a user. It is necessary to use credentials to authenticate with your environment (username and password or a token, which must be generated beforehand). The plugin configuration allows you to specify a title, description, priority, category, group, type of query. In addition, it will check whether there is already a ticket created with these features so that in case it is already created, it is only necessary to add its corresponding follow-up.

The plugin makes use of a parameter called “–recovery” that sets two different paths in its execution. If used, the plugin will check the status of the specified ticket and if it is not closed add a comment on it, if it is closed, it will not do anything else. If it is not used, the performance will be the same, but it will change if the ticket is closed or does not exist. If closed, it will create a new ticket. If it does not exist, it will create the ticket if there is a computer with the same name as the agent specified with the “–agent_name” parameter.

The plugin does not need additional dependencies for its use, since these are already incorporated. But it is necessary for in the GLPI environment to have rest api enabled, since the plugin makes use of it for ticket creation.

For that, access, in your GLPI environment, Setup → General

The “Enable Rest API” option must be enabled.
From that menu you may also enable whether you want to be able to authenticate with credentials, with tokens or both.

Once done, it will be possible to use the plugin, for that, it will be necessary to configure an alert command. By creating alert commands, you may specify and automate ticket creation.

This can be done from the alerts menu, in commands:

Enter a name, group, and the command, using as values for the parameters the macro _fieldx _, where x is the number of the parameter (they do not distinguish any order, each macro just needs to have a different number).

Once configured, you may configure the macro value below in the description fields.


About Version 2 Digital

Version 2 Digital is one of the most dynamic IT companies in Asia. The company distributes a wide range of IT products across various areas including cyber security, cloud, data protection, end points, infrastructures, system monitoring, storage, networking, business productivity and communication products.

Through an extensive network of channels, point of sales, resellers, and partnership companies, Version 2 offers quality products and services which are highly acclaimed in the market. Its customers cover a wide spectrum which include Global 1000 enterprises, regional listed companies, different vertical industries, public utilities, Government, a vast number of successful SMEs, and consumers in various Asian cities.

About PandoraFMS
Pandora FMS is a flexible monitoring system, capable of monitoring devices, infrastructures, applications, services and business processes.
Of course, one of the things that Pandora FMS can control is the hard disks of your computers.

How KPIs Help Us Monitor and Optimize Business Performance

Any IT strategist must keep in mind the business goal, so that their technology initiatives are aimed at delivering, rather than services and infrastructure, the added value of reliability and optimal performance that makes them achieve business goals and be more competitive. Read on to understand what KPIs are and how they help us with proper business management.


Definition of KPIs

According to Techopedia, un KPI (Key performance indicators) can be anything that an organization identifies as an important factor for the business. Under the principle that “if something is not measured, it is not improved”, a KPI measures results and, from there, if something deserves your attention, take actions to correct, improve and optimize. If your company is in retail, a KPI can be delivery times; in other companies, the sales close rate can be an extremely important KPI.
This means that even though KPI is a business-oriented term, IT strategists need to know what they are and what they are used for in business intelligence.

Examples of KPIs

Importance of KPIs in Business Management

KPIs help us measure progress, identify potential problems, and make decisions. To that end, KPIs must be defined according to a business management framework, with these features:

  • Be quantitatively and qualitatively measurable.
  • Have a goal related to the business.
  • Identify and solve variables in the organization.

To define IT KPIs, first you must understand business goals to align them with the business; then you may define business and type KPIs (financial, operational, sales, IT, etc.). With this, KPIs are written and monitored in real time and periodically.

How tools like Pandora FMS transform real-time KPI monitoring

Being able to measure the business with indicators ensures visibility on business performance, seeking to achieve objectives to be met and even exceeded. With Pandora FMS, it is possible to define custom dashboards with graphs and summaries, for monitoring KPIs in real time.

Example: User Experience (UX) Monitoring

Information centralization allows you to get the same display, streamlining communication and collaboration in your IT team. We invite you to learn about a success story in logistics by applying KPIs, by clicking on this link.

What are KPIs?

Understanding what KPIs are allows you to define them and know how to interpret them for the success of a functional area of the organization and their contribution to the overall success of the organization.

Concept of KPIs as measurable indicators

KPIs are the measures that have been selected to have visibility on organizational performance and are the basis for decision-making aimed at obtaining the expected results. KPIs are monitored and presented on dashboards to understand progress or alerts on an implemented strategy.

Difference between KPIs and general metrics

Even though KPIs and metrics measure performance, there are differences in their concept: KPIs are quantifiable measures to measure performance or progress on key goals for the organization and work as measurable benchmarks for long-term objectives. While metrics are quantifiable measures, they are used for specific business processes at operational level and in the short term.

Relationship between KPIs and the control panels offered by Pandora FMS

In Pandora FMS, from a single platform, you may have graphical interfaces that show KPIs in a visual, intuitive and organized way. You may display real-time data, analyze trends, make informed decisions, and take timely action. Each dashboard may be customized with charts, tables, and other visuals that represent KPIs. That allows KPIs to provide the essential metrics, while dashboards are an accessible and understandable way to visualize and analyze those metrics.

Pandora FMS Dashboard

Types of most common KPIs

One thing we recommend is to consider the best practices of each industry, as they help you identify the possible KPIs applicable to your organization, based on available data and constant monitoring. Some of the most common KPIs are:

  • Financial:
    • In sales, customer acquisition cost (CAC) measures the total cost of acquiring a new customer, including all expenses related to marketing and sales initiatives.
    • The profit margin is used to measure the amount of profit a company makes for each weight earned. This KPI reveals the amount of profit a business may retrieve from its total sales.
    • Cash flow evaluates the company’s ability to generate liquidity, which in turn reflects that it can pay the debts closest to expiration and also allows it to have a sufficient cash margin for possible defaults.
  • Operations:
    • The supply cycle time evaluates the average time from the generation of a purchase order to product reception.
    • Inventory turnover rate measures the number of times inventory is renewed in a defined period.
  • From IT:
    • Network uptime refers to the amount of time an IT infrastructure is operational and accessible. It is one of the most critical for IT management, as it has a direct impact on business productivity and efficiency.
    • Response time is what it takes for an IT team to respond to an incident, from the moment it is reported until it is identified and solved.

How Pandora FMS allows you to configure alerts and see these KPIs in a single dashboard

Pandora FMS platform is conceived to be able to configure alerts and display KPIs in the same dashboard efficiently and intuitively. To do so, the following steps should be followed:

    • alertswill be triggered. This may include incorrect values of a module, specific events, or

SNMP

    • .
    • Choose actions: Configures the actions that will be performed when an alert is triggered, such as sending an email, running a script, or logging an event.
    • Create commands: Defines the commands that will be run on Pandora FMS server when alerts are triggered. You may use macros to customize the parameters of these commands.
    • Assign groups: Define which commands are assigned to specific alert groups.

Once done, widgets (which are GUI elements, graphical user interface, or a small application that can display information and/or interact with the user) are added to the dashboard to display the KPIs you wish to monitor. You may include charts, tables, and other visuals. After adding them, widgets are customized to display the specific data you need, adjusting formatting, time intervals, and other parameters. Also, the dashboard is configured to be updated in real time, allowing KPI remote and continuous monitoring.

How to select the right KPIs

For KPIs to be effective, those that are truly aligned with the organization’s objectives must be appropriately selected. For that, implement KPIs that follow the same line as the company’s goals and strategic objectives.
As we said before, KPIs must add value to the organization, so it is important to know the strategic objectives and goals of your company (or the objectives of a strategic project) in order to define which KPIs make sense, since they must reflect progress towards that goal and its objectives. For example, if you have a manufacturing and distribution company, you should consider the KPIs we mentioned before, such as supply cycle time, inventory turnover rate, as well as production efficiency (percentage of productive time on the production line), total operating costs, delivery fulfillment, among others.

Practical example: selecting KPIs in a managed environment with Pandora FMS

The company Conferma, a provider of virtual payment technology in 193 countries, gives us an example of a selection of KPIs managed with Pandora FMS. For this company, the Confirmation Liquidation Platform (PLC) is fundamental, since it is the engine of reconciliation and liquidation. Monitoring was inefficient and time-consuming, considering multiple database servers, firewalls, load stabilizers, hardware security modules, virtual platforms, and web servers. Real-time display of data and processes was also required. By implementing Pandora FMS, it was possible to have tailor-made software and key database information to define the KPIs and dashboard to inform employees about the current performance metrics of the Conferma business platform, in addition to real-time automation of key performance statistics.

Tools to monitor and analyze KPIs

In management indicator monitoring, business intelligence and artificial intelligence turn out to be powerful tools to streamline the display and analysis of KPI performance, in addition to being able to automate corrective and even preventive tasks, which in sum makes the work of the IT team more efficient and quicker.

Importance of automation and display in KPI management

When leveraging automation for KPI management, data collection and analysis saves valuable time and avoids human error, and real-time insights are always critical in the up-to-date performance view. Automation also contributes to consistency through standardized and clear processes for everyone.
As for display, charts and dashboards are intuitive and clear knowledge material for everyone. Collaboration and communication are streamlined when we all have the same version of what is happening, allowing us to work in a more synchronized and effective way; and, of course, decision-making is done in a timely manner and is based on consistent and reliable information.

Pandora FMS-specific features

Pandora FMS has the capabilities to support your team in real-time display and monitoring of KPIs, such as:

  • Custom dashboard setup is a Pandora FMS feature that allows each user to build their own monitoring page. You may add more than one page, and in there you may add monitoring maps, graphs and status summaries, among other elements.
  • Remote and real-time monitoring, from the same platform, provides a detailed and updated real-time inventory of servers, network hardware, installed software packages, users, routers, etc. In addition, it offers real-time graphics for troubleshooting and performance monitoring. Also, APIs and remote monitoring are of great value for analyzing the state of the infrastructure and networks for a better response from your team.
  • Custom and detailed report generation to evaluate performance, and even from different areas, such as support, time management and projects. Custom reports can also be created with SQL queries. In addition, reports may be presented in different formats, such as HTML or PDF, and then automatically emailed to your customers.

Example of Pandora FMS report on SLA

Practical example of KPIs and their impact

To be clear about the impact of adopting KPIs, what better than a case study of implementing KPIs in a company that uses Pandora FMS:
At Salvesen Logística, logistics operator for food manufacturers and distributors. A tool was required that not only measured technical indicators such as performance, CPU, memory, etc., but also intelligence based on User Experience and business indicators. A probe programmed to simulate user behavior was implemented and every few minutes transactions are made on probes scheduled to emulate user behavior, at the same time transactions are made on the main global IT services for Salvesen customers. This comprehensive monitoring of key KPIs (such as order management, receptions, dispatches) allows you to maintain the expected service levels, in addition to being able to anticipate possible problems before they take place.

Obtained results: Reduced response times and improved SLAs. With Pandora FMS, transactional monitoring of the business has been implemented, reproducing the full cycle through which a message goes by, from when it leaves the customer, until it reaches our mailbox (Office 365, EDI, AS2, FTP, etc.). Pandora FMS has also been integrated with Salvesen’s WMS (Warehouse Management Service) and TMS (Transport Management System) platforms.

The main benefits have been:

  • Early alarms and proactivity management: detection of all service levels before it affects operations, allowing early reaction to tackle the issue, along with an automatic communication system with the employees or customers using template-based alarms (via email or SMS).
  • SLA management for comprehensive quality control of Salvesen Global IT Services. An executive report may be created for the management committee and senior management of the company. Also, SLA management allows you to have the information to be able to negotiate a contract renewal with a supplier.
  • Reduction of the operational load, saving 24% in the operational load of the IT area that previously had to do specific health checks, being able to focus on improvements in products and services for customers.

Conclusion

Business areas are clear about their initiatives and will be influencing decisions about IT initiatives that are aligned with the organization’s goal. You and your team must clearly define the IT KPIs that add value to the company, relying on tools with real-time information and in an intuitive way, in addition to taking advantage of business intelligence capabilities and automation that ensure the timely response of your team.
We invite you to rely on Pandora FMS to optimize monitoring, analysis and decision-making based on KPIs, by:

  • Automatic data collection from multiple sources, such as servers, applications and networks.
  • Alert and notification management, configuring automatic alerts to receive notifications in real time when problems or significant changes in KPIs are detected.
  • APIs to integrate business processes and automate configuration, notification and process management.

Reach out to our team of consultants to help you define KPIs and intuitive dashboard you and your team require.


About Version 2 Digital

Version 2 Digital is one of the most dynamic IT companies in Asia. The company distributes a wide range of IT products across various areas including cyber security, cloud, data protection, end points, infrastructures, system monitoring, storage, networking, business productivity and communication products.

Through an extensive network of channels, point of sales, resellers, and partnership companies, Version 2 offers quality products and services which are highly acclaimed in the market. Its customers cover a wide spectrum which include Global 1000 enterprises, regional listed companies, different vertical industries, public utilities, Government, a vast number of successful SMEs, and consumers in various Asian cities.

About PandoraFMS
Pandora FMS is a flexible monitoring system, capable of monitoring devices, infrastructures, applications, services and business processes.
Of course, one of the things that Pandora FMS can control is the hard disks of your computers.

Our “Wrapped-Up” 2024: Pandora FMS advances and accomplishments that marked the year

If Spotify can do its annual wrap-up, so can we! It is true that you will not discover your musical evolution this 2024, but you will be able to check all the advantages that one more year are added to the Pandora FMS portfolio and thereby improve your business operations.

2024 has been a transformational year for Pandora FMS, marked by significant advances and a clear focus on our customers’ global needs. We have strengthened our position as a leader in monitoring and observability, expanding our offering with key functionalities that integrate security into IT management. 

One of the most important milestones this year was the launch of Pandora SIEM, a solution that enables organizations to integrate cybersecurity into their daily monitoring strategy, proactively detecting and mitigating threats. This development reinforces our commitment to providing tools that go beyond traditional monitoring, helping our customers manage complex environments with complete confidence.

Pandora SIEM allows you to centrally visualize threats, identify those that are most critical, and ensure they are addressed by the right people. This streamlined approach simplifies threat management and safeguards your infrastructure.

We have also continued to improve our remote management solution (RMM), which is key for distributed environments, optimizing the monitoring and control of critical infrastructures. This tool adopts a global infrastructure visibility approach and establishes a preventive instead of being merely a reactive maintenance model, for example by automating tasks, which ultimately contributes to greater security and SLA compliance. This effort is reflected in the four new versions of ITSM released this year, each designed to respond to the changing demands of our users and ensure maximum flexibility in managing their systems. In addition, the integration of Pandora ITSM with Pandora FMS allows our users to unify ticket management from the Pandora FMS console.

Our results speak for themselves: more than 2,000 tickets managed with a remarkably positive satisfaction rate, and a total of 1,700 tickets under development processed, reflecting the continuous work of our team to perfect our solutions. Each new release has been made possible by a fully optimized development process, which this year has been radically transformed to achieve even higher performance.

Throughout the year, we also strengthened our international presence, standing out as a leading solution in more than 30 key categories on platforms such as G2, where we obtained an average rating of 4.5/5. Our commitment to innovation and flexibility has been recognized by customers in markets around the world, from large corporations to medium-sized companies, who value our ability to adapt to multiple technology needs.

Looking ahead to 2025, we are poised to continue to innovate and expand our capabilities. Our goal is clear: to provide even more robust solutions and remain the trusted technology partner for organizations in any industry, anywhere in the world. To this end, we intend to continue adding functionalities to Pandora SIEM, such as filters or advanced reports; as well as internal auditing to Pandora RMM. We will also continue to explore the limits of monitoring, including user activity monitoring.

About Version 2 Digital

Version 2 Digital is one of the most dynamic IT companies in Asia. The company distributes a wide range of IT products across various areas including cyber security, cloud, data protection, end points, infrastructures, system monitoring, storage, networking, business productivity and communication products.

Through an extensive network of channels, point of sales, resellers, and partnership companies, Version 2 offers quality products and services which are highly acclaimed in the market. Its customers cover a wide spectrum which include Global 1000 enterprises, regional listed companies, different vertical industries, public utilities, Government, a vast number of successful SMEs, and consumers in various Asian cities.

About PandoraFMS
Pandora FMS is a flexible monitoring system, capable of monitoring devices, infrastructures, applications, services and business processes.
Of course, one of the things that Pandora FMS can control is the hard disks of your computers.

×

Hello!

Click one of our contacts below to chat on WhatsApp

×