Skip to content

Get on the DeLorean: Digital transformation over time!

We travel back in time in search of the first digital transformation

“-Jimmy! Define Digital Transformation!
-I haven’t studied it…
-There are no excuses, it is a very intuitive and well-known concept, even for an elementary school student.
-Mmm…
-Come on, Jimmy! Or I’ll give you an F that will give you blisters!

It was right then that Jimmy rose like a spring, and with his mind blank and his gaze clouded, he snapped a sonorous and mechanical sound to the horizon:

“Digital transformation is that change or advance relative to any application of new digital technologies in all aspects and aspects of human society.”.


-BRAVO, JIMMY! BRAVO!, applauded the whole class.

That day they carried Jimmy out of the building on their shoulders and immediately instituted summer vacations for the entire school, in the middle of October. From here we can only say: Thanks, Jimmy. We will use your neat and undeniable definition to trace today, on Pandora FMS blog, a journey through time in search of the first notions about digital transformation and its consequent repercussions. So join us, if you like, on our tuned, hybrid, and full of diesel DeLorean, to make an absolute reference to Back to the Future.

Digital Transformation in 2011, 2013 and 2015

We have already burned wheels in two parallel lines of fire with our DeLorean and we have reached 2015. Do you remember? Jorge Lorenzo won his third MotoGP World Championship and Juan Goytisolo received the Cervantes Award. That same year the research center MIT Center for Digital Business and the private firm Deloitte declared: “mature digital businesses are focused on the integration of digital technologies, such as social, mobile, analytics and cloud, at the service of the transformation of how business is done. In contrast, less mature businesses are focused on solving discrete business problems with individual digital technologies.” Is it clear enough? If you are not applying digital transformation, your chances of being left behind are high then.

In 2013, the Year of Faith according to the Catholic Church and the year of Luigi according to Nintendo. Not that long ago, not even a line on our DeLorean’s tank marker, we found a very uneven analog-digital conversion, according to Booz & Company, the global strategy consulting team. We are talking about sectors and countries lagging behind in converting from analog to digital. I am sure that if you look back, you will remember the uncertainty and slowness of analog technology. Politicians and strategists at the helm around the world had to step up the development ladder in this paradigm shift. The economy depended on it!

In 2011, with the death of Steve Jobs and the beatification of Pope John Paul II, we find that only a third of the companies around the world have a particular program of truly efficient digital transformation. Sad, yes, but as we travel backwards we will feel this crudeness more strongly.

Digital Transformation in 2000

We refuel our DeLorean in 2000, big milestones of the year? I got Pokemon Gold with Typhlosion at level 91. At that time, digital transformation was a fact very much in mind and in which they were already working, but the arrival of the three Ws (World Wide Web) changed, profusely, the speed and scope that digitization would show. There was increased pressure from societies to pass this process.

Digitization had become a concept/argument that was used at all times. And of course, it had to do with the increased use of the Internet and IT at all scales. This climate, already so common in companies, made us all aware of the issue and even the EU, for example, created the Digital Single Market. From this place arose many of the ideas with which the political agendas of the different countries of the Union were nurtured. The transformation of their different societies began gradually.

Digital Transformation much further back in time

I know you didn’t expect our DeLorean to be past eighty. After all, many believe that from there, apart from the unquestionable Back to the Future franchise, comes all the magic of digitization. However, it is time to accelerate. The Flux Condenser will fume but it will be worth it. If we get stuck in the past, with no possibility of returning, we will learn its customs and form a new family while we make ends meet by investing in aspirin or the gramophone.

In 1703, the King of Portugal, Pedro II, declared himself opposed to the cause of Philip of Anjou and Tsar Peter the Great founded the city of Saint Petersburg. However, the digital transformation has to give thanks at that time to Gottfried Wilhelm von Leibniz, who, attentive, gave birth to the concept of digitization in one of his most transcendental publications: “Explication de l’Arithmétique Binaire”. Years later, 1854, 1938, approx, geniuses as renowned as George Boole and Claude Elwood Shannon complemented and developed it.

In 1939, World War II begins and Gaby, Fofó and Miliki decide to form a comic trio of clowns. But we also have George Stibitz, known in the trade for his work on the development of digital logic circuits and, nothing more and nothing less, than for laying the foundations of the first digital computer. In addition to popularizing the term “digital”, very important for this article.

In 1961, Yuri Gagarin becomes the first human being to travel to outer space and Roy Orbison releases his debut album, “Roy Orbison at the Rock House”. But who interests us is Leonard Kleinrock, the American, engineer and science teacher who conceives the Internet in his work “Information flow in large communication networks”. To this day (the day the article is published), this man is still alive. Better go pay tribute to the door of his house. He resides between New York and Los Angeles and likes camellias.

In 1969, the arrival of Apollo 11 to the Moon and the Beatles’ last public performance. The ARPANET network was also created, commissioned by the US Department of Defense, and which is basically the seed of what we now know as the Internet.

Now that we have returned, unscathed, from our journey in search of the past milestones and nuances of the “Digital Transformation” concept, and now that the DeLorean is parked, until the next adventure (in which we will undoubtedly go see a Tyrannosaurus Rex or a Queen concert), we can resolve that the digital transformation has led to important changes within business models, social and economic structures, political and legal decisions, culture and other organizational patterns that guide us in the present. The concept went from a small and private sector to reach the hands of a huge public, always eager to master new technologies. The question is: In this new kingdom, as we have seen, new and old at the same time, what is your place?

About Version 2 Digital

Version 2 Digital is one of the most dynamic IT companies in Asia. The company distributes a wide range of IT products across various areas including cyber security, cloud, data protection, end points, infrastructures, system monitoring, storage, networking, business productivity and communication products.

Through an extensive network of channels, point of sales, resellers, and partnership companies, Version 2 offers quality products and services which are highly acclaimed in the market. Its customers cover a wide spectrum which include Global 1000 enterprises, regional listed companies, different vertical industries, public utilities, Government, a vast number of successful SMEs, and consumers in various Asian cities.

About PandoraFMS
Pandora FMS is a flexible monitoring system, capable of monitoring devices, infrastructures, applications, services and business processes.
Of course, one of the things that Pandora FMS can control is the hard disks of your computers.

Do you know what VMWare is and how to include it in monitoring?

Find out what VMWare is and how to include it in monitoring

Background

Before we dive into how to monitor virtualized environments with VMWare, let’s clarify a couple of concepts for those who are less into the subject, starting withWhat is VMWare?.

VMWare is a software product development company, mostly related to virtualization, and more recently to containerization, although this is beyond the scope of this article. Today, we are going to focus on monitoring virtualized environments with VMWare.

To do this, the first step would be to know what virtualization is. A quick summary, and a bit imprecise I must say, but that will give you a general idea. We can claim that virtualization is like dividing the components (CPU, Memory, Disk, etc.) of a physical computer or server (which we will refer to from now on as Bare-Metal) into virtual or emulated components. This will allow us to share the same component between different instances which we will call “virtual machines.” That way, using a single set of hardware, you may have different virtual machines running different versions of operating systems, applications, libraries, etc. simultaneously and separate from each other.

The interesting thing about this is that, for the virtual machine (which we will refer to as VM from now on), the resources that have been assigned to it are only from it and are real elements. This opens a world of possibilities, it allows you to have many services and virtual machines running on a single hardware device with the energy, space and cost savings that this implies. In addition, since it is all at software level, it will allow you to manage the machine as one more file inside the computer, being able to copy it, modify it or even package and distribute it.

The advantages of virtualization are more than proven and today almost any service and infrastructure runs mostly on virtual servers. A very clear example is when you go to your favorite cloud provider and click a button to activate an instance of a database or a server, actually what you’re doing is activating a virtual machine that it already had pre-configured and that can work for you in a matter of seconds, thanks to this technology.

Due to these types of advantages, and because of the massive distribution of virtual machines in most ecosystems, it is so important to have a monitoring tool capable of adapting to this type of environment efficiently.

Now that we know what virtualization is, we will see a new concept. We already said that from a physical machine we can emulate and subdivide its components to create instances of smaller virtual machines, and it is true, although there is a small nuance, we require software devoted to this, we call this software hypervisor.

There are different types, manufacturers and features we are not going to delve into today. If you are interested in this topic and want us to do a more detailed article on virtualization leave it in the comments

vSphere

Today we will focus on one of VMWare’s most widespread and well-known products: the vSphere suite which, according to Wikipedia, “is VMware’s core business suite, the cornerstone on which almost all the business products they offer rely on. It consists of the ESXi virtualization software that is installed directly on the servers and the centralized management console vCenter.2020 ”

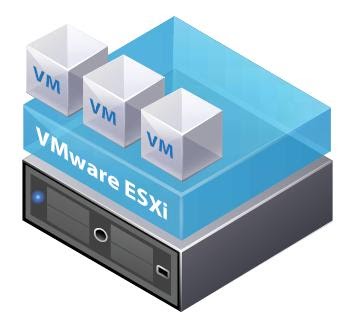
As we have seen, vSphere is the name of the set of tools that VMWare offers for device virtualization, there is a range of different vSphere environments, from a single ESXi server that works as a hypervisor as well as management.

ESXi

Stand alone ESX [esxi.jpg]

To much more complex environments where several ESXi work in parallel being managed by a centralized administration software called vCenter.

vsphere

vSphere Vcenter [vsphere.png]

Virtual environment monitoring

To monitor virtual environments, whether it is from VMWare or not, there are two main ways.

The first is to treat each virtual machine as an independent machine, attacking its operating system with standard protocols or using some monitoring agent.
This approach does not require for the tool have a special or devoted management, since it will deal with each VM as any other machine. Along this approach, we can say that we will interrogate the operating system, therefore, in heterogeneous environments, we must define metric captures for each system.

The second way is more general and allows deploying monitoring very quickly and efficiently. In this case we will integrate the hypervisor, since it has information on all the machines it contains and we can interrogate it directly. For each manufacturer the protocol, the responses and the format with which we will interrogate the hypervisor may vary, but in most cases they have an interface to communicate with it. Along this approach, it is the monitoring tool that must be adapted and have a connector to communicate with the supervisor in a centralized way.

Of course, Pandora FMS has both types of monitoring, being able to combine them if necessary if deep and detailed monitoring is required.

In today’s case, we will see the monitoring integrated in Pandora FMS Enterprise Discovery tool. That will allow us, in a very simple way, to connect well, either with a standalone ESX or with a vcenter, through the vmware SDK.

vSphere Monitoring with PandoraFMS

Starting from the fact that we have a Pandora FMS Enterprise instance, the steps are very simple: by default Pandora FMS has the necessary libraries to connect to a VMWare environment, you only need a user account with reading permissions and connectivity with the ESX or vCenter as the case may be.

Once you fill in the simple form with the data from our VMWare environment:

discoveryapp

[discoveryapp]

form2

[form2]

You will see a window to configure some monitoring data, such as the scan interval for new machines, the execution threads that you will devote to this task, if you want to activate network monitoring and (only for vcenter), if you want to capture the environment events.

You will also have a field for extra configurations that will allow you to add advanced configurations related to the task (you can see the possible configurations:
https://pandorafms.com/manual/en/documentation/03_monitoring/05_virtual_environment_monitoring?s[]=vmware#vmware 1 plugin ocnfiguration ).

form3

[form3]

Once finished, you will be able to see that a task has been added to Pandora FMS task list, where you will be able to see its last execution, enable it, disable it or force task execution manually.

form4

[form4]

The default task will give you information about all the ESXs (in the case of vcenter), virtual machines and datastores available in the vmware environment that you configured, returning the following metrics:

Default monitoring for Datacenter:

  • Ping
  • Check 443 port

Default monitoring for Datastore:

  • Capacity
  • Free Space
  • Disk Overallocation
  • Free Space Bytes

Default monitoring for ESXi:

  • CPU Usage
  • Memory Usage
  • Received data
  • Transmitted data
  • Disk Read Latency
  • Disk Write Latency
  • Host Alive
  • Disk Rate
  • Net Usage

Default monitoring for virtual machines:

  • CPU Usage
  • Memory Usage
  • Tools Running Status
  • Host Alive
  • Disk Free
  • Disk Read Latency
  • Disk Write Latency
  • Received data
  • Transmitted data
  • Net Usage

In addition to the metrics described, you will also have a specific view for monitoring vSphere environments that has compilation information on the general state of the environment and each monitored ESX and even a map of the monitored infrastructure.

vmwareview1

[vmwareview1]

view2

[view2]

view3

[view3]

As you can see, it is very easy to start monitoring a vSphere environment with Pandora FMS, just follow a few steps and you will have your VMWare monitoring integrated quickly and easily.

If you are interested in knowing in more detail how synthetic transactions are configured and executed with Pandora FMS, do not hesitate to visit our YouTube channel, where you may find different contents such as tutorials, workshops and a lot of other resources devoted to this and many other topics related to monitoring.

About Version 2 Digital

Version 2 Digital is one of the most dynamic IT companies in Asia. The company distributes a wide range of IT products across various areas including cyber security, cloud, data protection, end points, infrastructures, system monitoring, storage, networking, business productivity and communication products.

Through an extensive network of channels, point of sales, resellers, and partnership companies, Version 2 offers quality products and services which are highly acclaimed in the market. Its customers cover a wide spectrum which include Global 1000 enterprises, regional listed companies, different vertical industries, public utilities, Government, a vast number of successful SMEs, and consumers in various Asian cities.

About PandoraFMS
Pandora FMS is a flexible monitoring system, capable of monitoring devices, infrastructures, applications, services and business processes.
Of course, one of the things that Pandora FMS can control is the hard disks of your computers.

WHAT’S NEW Pandora FMS 755

What’s new in the latest release of Pandora FMS, Pandora FMS 755

Let’s review together the features and improvements related to the new Pandora FMS release: Pandora FMS 755.

HOW TO UPDATE PANDORA FMS

There are several ways to update Pandora FMS console:
  • Through Update Manager, in Pandora FMS console itself, automatically (it requires console internet connection).
  • Through Update Manager, in Pandora FMS console itself, manually, through OUM update files.
  • By manually installing RPM packages and later updating the console through the web interface.
The server will have to be manually updated through RPM or tarball packages. You may find more information about Pandora FMS downloads on our website: For detailed information and the steps to follow to update each item, classified by operating systems, go to our Wiki.

NEW FEATURES AND IMPROVEMENTS

New agent installer for MacOS

release-755-1 In this version we released a graphical installer for MacOS agents.

New interface view

A new specific view has been added to be able to see the network interfaces that are being monitored. On the one hand, there is the general view where you can filter the different agents that carry out said monitoring and on the other hand, a special view within each agent. release-755

New online documentation

We have migrated our online documentation system to a new site: https://pandorafms.com/manual which allows better searches, better navigation and better mobile usability. It also allows exporting on demand in PDF and very soon also in eBook (ePub) format. release-755

New Metaconsole interface

The visual interface of the Metaconsole has been modified to improve its navigability and display, adding the left side menu similar to that of the node. We have also unified some styles that will make working with the Metaconsole more familiar to how you work with the node. release-755

New Update Manager (WARP update)

WARP is the new version of the old Pandora FMS update system (Update manager). This new version allows you to apply server and console updates without having to execute any command in the terminal. In the Metaconsole, updates are applied in a distributed manner from the Metaconsole to the nodes, with a simple click. From now on, updates incorporate a digital signature so that the source of said update can be manually validated (both online and offline). release-755 release-755

Agent inventory

We have created a new type of report that is used to list the installed agents. Among other metrics, you can see the IP, main group, secondary groups, description and other data. These reports can also be exported to CSV and XML.

Full console translation into Russian

We have translated and revised 100% of the console into Russian. We are also working on the Russian translation of the online documentation.

release-755

SPECIAL UPDATE NOTES

Due to the new version 755 update system, WARP Update, it is necessary to perform a couple of extra steps in the console after updating the server. From version 755, the server will be automatically updated from the console using the pandora_ha component that already existed in the Enterprise version and that is now open for the Community. This component allows you to control server performance (stopping and starting it, controlling the status of HA and updates, if any). Before updating the server it will be necessary to stop the server: service pandora_ha stop /etc/inid.d/pandora_server top And start it again after updating it: service pandora_ha start Or through the init.d script that has been modified to start pandora_ha /etc/init.d/pandora_server start

About Version 2 Digital

Version 2 Digital is one of the most dynamic IT companies in Asia. The company distributes a wide range of IT products across various areas including cyber security, cloud, data protection, end points, infrastructures, system monitoring, storage, networking, business productivity and communication products.

Through an extensive network of channels, point of sales, resellers, and partnership companies, Version 2 offers quality products and services which are highly acclaimed in the market. Its customers cover a wide spectrum which include Global 1000 enterprises, regional listed companies, different vertical industries, public utilities, Government, a vast number of successful SMEs, and consumers in various Asian cities.

About PandoraFMS
Pandora FMS is a flexible monitoring system, capable of monitoring devices, infrastructures, applications, services and business processes.
Of course, one of the things that Pandora FMS can control is the hard disks of your computers.

Pandora FMS and Nagios back in the ring. The final comparison

The battle begins again: Pandora FMS Vs Nagios. ¡FIGHT!

NagiosXI is the proprietary heir of one of the best-known tools in IT to monitor systems without a license, that is, as a free product. As a free product, Nagios (without XI) is a product that is almost 20 years old and suffers from many shortcomings, but for many years it has been the standard among “free” products and it fulfilled its role in those cases where the budget was quite short or the features needed were just a few. In recent years, its role as a free tool has been replaced by the more modern Zabbix.

Product features

Nagios XI is not a product as such, but rather it combines several pre-existing independent components. The best example is, for example, Nagios XI WEB management interface, with several elements, each one with its own credential system. Other system components installed on the Nagios XI appliance include:

  • Nagios XI UI: “Overlying” interface on the “basic” Nagios interface.
  • Nagios Core: Traditional interface.
  • NSCA: Agent for passive and plugin tests (not maintained since 2011).
  • NSPA: Agent for passive and plugin tests, with remote management.
  • NRPE: Agent for running Nagios plugins.
  • NRDP: Agent, theoretically a replacement for NSCA, whose development has not been updated since 2012.
  • Nagios Plugins: Monitoring scripts. There have been several community “forks”.
  • NagiosFusion: System similar to Pandora FMS Metaconsole.
  • Netflow Analyzer: Specific component to work with Netflow/SFlow flows.
  • Nagios Log Server: Log storage and monitoring system.

Each component with WEB interface has its own “look & feel”, its own user management system and, of course, its own configuration and integration with other elements. And these are elements designed by the company itself, Nagios Enterprise.

Third-party “OpenSource” components

  • PNP: Plugin to monitor performance using RRD binary databases.
  • Nagvis (maps): User-defined maps.
  • NDOUtils: Information export from nagios to SQL.
  • NSClient ++: Alternative agent that supports Nagios/Icinga.
  • NagiosQL (modified): Administration interface with data storage in MySQL.

None of these elements, which make up the “Nagios XI” solution, are even by Nagios itself, so the compatibility and coherence between them is relative. In many cases, no one can guarantee the quality or maintainability of those pieces of software.

Feature table comparison between Pandora FMS and Nagios

General featuresNagiosPandora
User Experience monitoringNOYES
Availability monitoringYESYES
Performance monitoringPartialYES
Event managementNOYES
Event correlation systemNOYES
MultitenantNOYES
Log collectionYESYES
Centralized management using monitoring policiesYESYES
Certified Security UpdatesYESYES
GeolocationNOYES
Command line managementNOYES
LDAP/AD authenticationYESYES
Virtualization and cloud computingYESYES
High availabilityYESYES
Horizontal scalability (Metaconsole)YESYES
Service monitoring (BAM)NOYES
Customizable visual consoleYESYES
Synthetic modules (dynamic creation of data on existing data)NOYES
Historical database for long-term data storageNOYES
Centralized plugin distributionYESYES
z/OS monitoringNOYES
SAP R3 & S4 monitoringNOYES
Remote control (eHorus)NOYES
Agent technologyNagiosPandora
Multiplatform agents for Windows, HP-UX, Solaris, BSD, AIX and LinuxYESYES
Remote management of software agent configuration (with policies and manually)YESYES
Agents for Android, IOS and embedded systemsNOYES
Remote inventory or with agentsNOYES
Centralized virtualization monitoring: Vmware, RHEV, XenServer, HyperVYESYES
Oracle, Informix, SyBase, DB2, Weblogic, Jboss, Exchange, Citrix, WebSphere monitoring (among others)PartialYES
Reports and graphsNagiosPandora
Customization of reports (first page, header, images, dynamic content, static content)NOYES
Up to 6 decimals of precision in SLA reportsNOYES
Fine-grain ACL system. 100% multitenant ready for SaaSNOYES
SLA advanced reports (daily, weekly, monthly)NOYES
DashboardYESYES
Planned stops and exclusionNOYES
Report templatesNOYES
Network featuresNagiosPandora
Network L2 topology detection and self-discoveryNOYES
IPAM (IP Address Management)NOYES
Decentralized SNMP and WMI monitoring (proxy servers, satellite servers)NOYES
SNMP trap monitoringYESYES
Dynamic network navigable maps, modifiable by the user in a graphical environment (Network console)NOYES
High-speed ICMP and SNMP scanningNOYES
NetflowYESYES
SSH/Telnet ConsoleYESYES

Points against Nagios

Monitoring current technologies

New check creation is based on wizards or plugins. In both cases, you have to be an expert to modify any of them (you have to program at command level, know the specific template definition language and manually debug), which makes it difficult to broaden the variety of checkups or customize one of them easily from the interface itself. In Pandora FMS, any extension can be carried out using the WEB interface, without getting down to the console level, in addition to offering a bigger plugin collection for business software that does not require any kind of coding.

When applying settings, you need to “compile” them so that if something goes wrong, changes cannot be applied until they are corrected. This would be insane in an environment with many hosts. Deleting an agent without first deleting the service it contains prevents you from making the change, but it does not solve it, for example. In Pandora FMS, the entire operation is in real time, or in the case of applying major changes, managed in the background by the system, without interruptions or the need to interact at a low level with the system.

Management automation

In general, monitoring is so manual that it would take a long time to monitor 100 agents, unless low-level scripts are created to automate the whole process, so there is no standard nor tools that allow automation, or good practices, it depends exclusively on the ability of the “nagios expert” to automate these tasks efficiently, which is a completely manual process.

Reports

Although Nagios has “custom” reports, this customization is limited to parameterizing the already available reports, which are only of 20 types. Each report shows a type of information available with a pre-set presentation, for example the SLA:

nagios1

Filters can be added and saved as favorites, but it is not a report that can be much more customized. To sum up, reports are intended for the technician’s use, never to be used for an internal or external client. Reports do not allow to combine different types of elements or to show generic graphs of specific metrics.

Usability in large environments

Console load for very few agents is extremely high. The usability with a high number of systems is very poor. Although it can be made to monitor many systems, it clearly has not been designed for it. Pandora FMS is currently being used to operate and manage systems with more than 100,000 nodes.

Windows Agents

Nagios “Advanced” Agents for Windows (NSCA) are from 2011 and there have been no updates since then. There are several “Forks” (iCinga, ISCA-NG), but not for Windows. Despite the fact that Nagios has up to four types of agents (NRPE, NSCA), their performance and power is far from being comparable to that of Pandora FMS, especially in Windows environments.

Performance monitoring

Until very recently, Nagios used third-party software to manage performance data and graphics. It has now been integrated, but it remains a tailored third-party component, and not part of its initial architecture. Pandora FMS is a native capacity tool, it can be used to elaborate dashboards, since it works with data and an SQL engine from its first version.

Lack of event management

Nagios does not perform event-based management, it cannot automatically validate events from monitors that have been retrieved, it cannot group them, and it cannot specify event-based alerts. To tell you the truth, there is no “event” concept in Nagios as in other tools (OpenView, Tivoli, Patrol, SCOM, Spectrum, etc). Pandora FMS has evolved based on requirements of former users of these tools, so the level of compliance with industry standards is very high.
For Nagios, the events consist of a text log for a simple visual review, as seen in the following screenshot:

nagios2.

Nagios cannot do a root cause analysis,

Since there is no event correlation. PandoraFMS does have it, and it also has multiple tools (L2 Maps, Services, Alert Escalation, Cascade Protection) that help the user in this regard.

Nagios cannot do BPM (service monitoring)

With Nagios you cannot set a hierarchy based on weights of different elements from different systems. Pandora FMS has a specific component (Service Maps) for this specific point.

Network level deficiencies.

Nagios cannot display a physical network, since it is not capable of detecting or displaying link-level topologies. This limits switch and router monitoring. Furthermore, its network maps are not interactive nor can they be edited or customized unlike Pandora FMS Enterprise.

Its SNMP trap monitoring is not integrated with monitoring and therefore no added graphs, reports or alerts can be displayed. The same applies for its Netflow monitoring interface, which is conceived as an auxiliary tool.

Dashboard and custom visual displays

The closest thing to Pandora FMS visual consoles on Nagios are the third-party NAGVIS plugin that has barely evolved in the last 15 years. Nagvis is an external plugin, which is not even fully integrated with Nagios XI. Even going so far as to have a different look & feel:

nagios3

Although Nagios also has a Dashboard with a concept similar to that of Pandora FMS, it does not have basic elements, such as showing graphs of each monitored element, or numerical data of the collected values. It happens in a similar way with reports, which have “predefined” elements that provide little or no flexibility when it comes to building your own dashboards.

Permission management and Multi-tenancy

NagiosXI is not intended to work in a complex organization, where different administrators and users with access to different groups of machines can coexist. Its access segregation is very basic:

nagios4

The scenario where you may have several dozen, with different ACL permissions by user groups is not even contemplated. Although it has an audit log, it is not useful to know what the administrator or users do with the tool, it is more like a server diagnostic tool.

Conclusions

Nagios is a software tool that can be useful in environments where there is already a person with advanced knowledge of Nagios who takes care of everything and adapts it manually according to the needs of the environment. The company does not have a “Nagios”, it has a “person who knows about Nagios”, so the cost of the total solution is really the cost of that person, including a possible replacement. In this case you don’t pay for license nor maintenance, but the hidden costs are of other nature. Tool customization and evolution depends entirely on that person. It is not a standard solution, it is a completely “ad-hoc” solution.

100% of our clients, prospects or consulted companies that use Nagios, actually use the “free” version of Nagios, which has less features than those included in this comparison. There are many Nagios forks, the most popular are Icinga or Centreon. There are commercial alternatives with a higher quality than that of Nagios XI, the best representative would be OP5.

Nagios XI is a tool whose main strength is its license price, which in most cases is free, and which even in the case of paying for the “Enterprise” version is more competitive than Solarwinds or Whatsup Gold just to name a few.

Pandora FMS is a tool that competes – and has already replaced in several cases – tools from IBM, HP, CA and BMC such as Tivoli, OpenView, Spectrum and Patrol. The scope, resources and scope of the projects are clearly different.

About Version 2 Digital

Version 2 Digital is one of the most dynamic IT companies in Asia. The company distributes a wide range of IT products across various areas including cyber security, cloud, data protection, end points, infrastructures, system monitoring, storage, networking, business productivity and communication products.

Through an extensive network of channels, point of sales, resellers, and partnership companies, Version 2 offers quality products and services which are highly acclaimed in the market. Its customers cover a wide spectrum which include Global 1000 enterprises, regional listed companies, different vertical industries, public utilities, Government, a vast number of successful SMEs, and consumers in various Asian cities.

About PandoraFMS
Pandora FMS is a flexible monitoring system, capable of monitoring devices, infrastructures, applications, services and business processes.
Of course, one of the things that Pandora FMS can control is the hard disks of your computers.

New channel program as a business development strategy

Ártica Pandora PFMS launches a new channel program for partners as a key element in its business development strategy.

Ártica Pandora PFMS, within the framework of its global growth strategy, is evolving its channel program with the firm intention of expanding its worldwide network of partners. We will do so together with companies that complement, with their knowledge of the clients’ business, the wide range of monitoring, incident management and remote management services provided byPandora FMS, Pandora FMS Remote Control and Pandora FMS ITSM products.

At Pandora FMS we understand the importance of the benefits provided by a quality service, and, therefore, we want to develop the potential of professional IT companies whose purpose is to improve their clients’ business through knowledge and proper IT infrastructure use.

Since our main objective is the service quality for the users of our solutions, we especially focus on the qualification of our partners. We know for a fact that deep knowledge of our tools increases their productivity, while reducing the time spent by technicians. Effectiveness and efficiency that are achieved through custom training, and that can reproduce the customer environment so that partner-customer integration is fast and efficient.

The new Pandora FMS channel program embraces any size of company, from service providers to MSPs, consultancies, system integrators, distributors, etc. Of course, as long as they understand the value that monitoring and knowledge of the status of the IT infrastructure provides in the positive evolution of their business.

It is a simple program, easy to understand and comply with, without any tricks or hidden conditions. Flexible, with the ability to adapt to the needs of partners and their customers. Consistent, based on many years of experience attending and understanding the particularities of the channel and always aimed at providing the maximum benefit, direct and indirect, to companies that place their trust in us.

Now Pandora FMS partners self-qualify based on their commitment on three levels: Silver, Gold and Platinum. We certify that any of the levels is perfectly qualified to represent, with guarantees, Ártica PFMS products before clients. Our channel program also contemplates complementing the small deficiencies that may arise with our own manufacturer services, of the highest level.

All of our partners will have commercial interlocutors who, listening to customer requirements, understand their needs and are able to propose the appropriate solution. Gold partners will also have a qualified and certified technical team to install and adapt our solution to the client. And, of course, Platinum partners will enjoy higher independence and a higher volume of commercial and technical resources, which will allow them much more agile response times.

For Pandora FMS, the word “partner” means commitment, so the entire company has acquired the responsibility of helping to develop the channel’s business. From our first resource to the last (technical, presale, commercial, marketing, administration…) we are all available to our partners to minimize their own needs and maximize their business generation.

Each of our collaborating partners has their idiosyncrasies and their catalog of solutions, and the success of our channel program lies in the way we adapt Pandora FMS products to said portfolio, seamlessly, so that the organization of our partners, as a whole perceives that your solutions are scaled up without the need for patches or technical or commercial efforts.

We share the path, we work on demand generation, either directly through events and campaigns for predefined clients, or indirectly through social networks, generalist and economic press, press specialized in information technology or presence in sector fairs. We actively collaborate also providing all kinds of commercial information on the product portal.

Once the need is created, we reinforce, with our presence, the work of the salespeople, both in the initial stages of validation of the opportunity, and in the realization of presentations and custom demonstrations to clients, including, depending on the demand, tests of concept or even pilots with real data. We always leave the relational initiative to our partners, to whom in no case do we discuss the ownership of the opportunity, we only stay by their side in the sales cycle, thus guaranteeing avoiding conflicts between partners that may cause image and productivity loss in end customers.

Once the agreement with the clients has been reached, we continue to be by the side of our collaborators, providing them with all those services they need to complement their training and guaranteeing the success in the project’s execution.

And we don’t stop there, because we know that the relationship with a client does not end with an installation, but that it is something alive, constantly evolving, like our products, which include improvements (releases) from three to five weeks. Our direct support, or through the partner, is able to cover, with continuous coverage, the demand of the end companies that trust us.

In short, at Pandora FMS, we take our business very seriously, as much as any company with which we have the pleasure of collaborating, and, therefore, we have chosen a simple, flexible and seasoned channel model, which allows for the money generated by the ecosystem of partners that we are creating to affect and feed it. So the services we offer, together, obtain a productive knowledge of everyone’s information technology infrastructure, and this helps businesses grow in a sustainable way with the minimum operating cost.

If you are already a Pandora FMS partner, ask us more about how to grow together and, if you are not yet, find out all the details of the new partner program and contact us. We are sure to find quick business synergies.

About Version 2 Digital

Version 2 Digital is one of the most dynamic IT companies in Asia. The company distributes a wide range of IT products across various areas including cyber security, cloud, data protection, end points, infrastructures, system monitoring, storage, networking, business productivity and communication products.

Through an extensive network of channels, point of sales, resellers, and partnership companies, Version 2 offers quality products and services which are highly acclaimed in the market. Its customers cover a wide spectrum which include Global 1000 enterprises, regional listed companies, different vertical industries, public utilities, Government, a vast number of successful SMEs, and consumers in various Asian cities.

About PandoraFMS
Pandora FMS is a flexible monitoring system, capable of monitoring devices, infrastructures, applications, services and business processes.
Of course, one of the things that Pandora FMS can control is the hard disks of your computers.
×

Hello!

Click one of our contacts below to chat on WhatsApp

×