Grafana is an open source platform for real-time data display and monitoring. One of its functions is the creation of interactive and customizable dashboards that make metric analysis from several sources, such as databases, monitoring systems and cloud platforms.
Its flexibility and compatibility with multiple data providers make it an essential tool for observability and decision making in IT environments.Content:
What advantages does it offer for your infrastructure?
- Real-time monitoring of metrics and logs.
- Support for multiple data sources, such as Prometheus, InfluxDB, MySQL, AWS CloudWatch, and more.
- Customizable alerts and notifications for a proactive response.
- Intuitive and highly customizable interface for effective visual analysis.
- Scalability and extensibility through custom plugins and boards.

Grafana integration with Pandora FMS
Grafana has an integration in Pandora FMS, which allows to merge both monitoring platforms. In order to use this integration, only a few minimum prerequisites are necessary:- API extension loaded in Pandora.
- Access from Grafana to Pandora machine from which you will receive the data and which has the API Extension loaded.
- Enable the plugin ID in the Grafana configuration file.
1. Add Pandora FMS Extension
First of all, start in your Pandora FMS console the extension that will allow you to obtain the data to be represented in Grafana dashboards. To that end, just download the ZIP package that you may find in your library and upload it to Pandora FMS console from the menu: Admin tools > Extension manager > Extension uploader: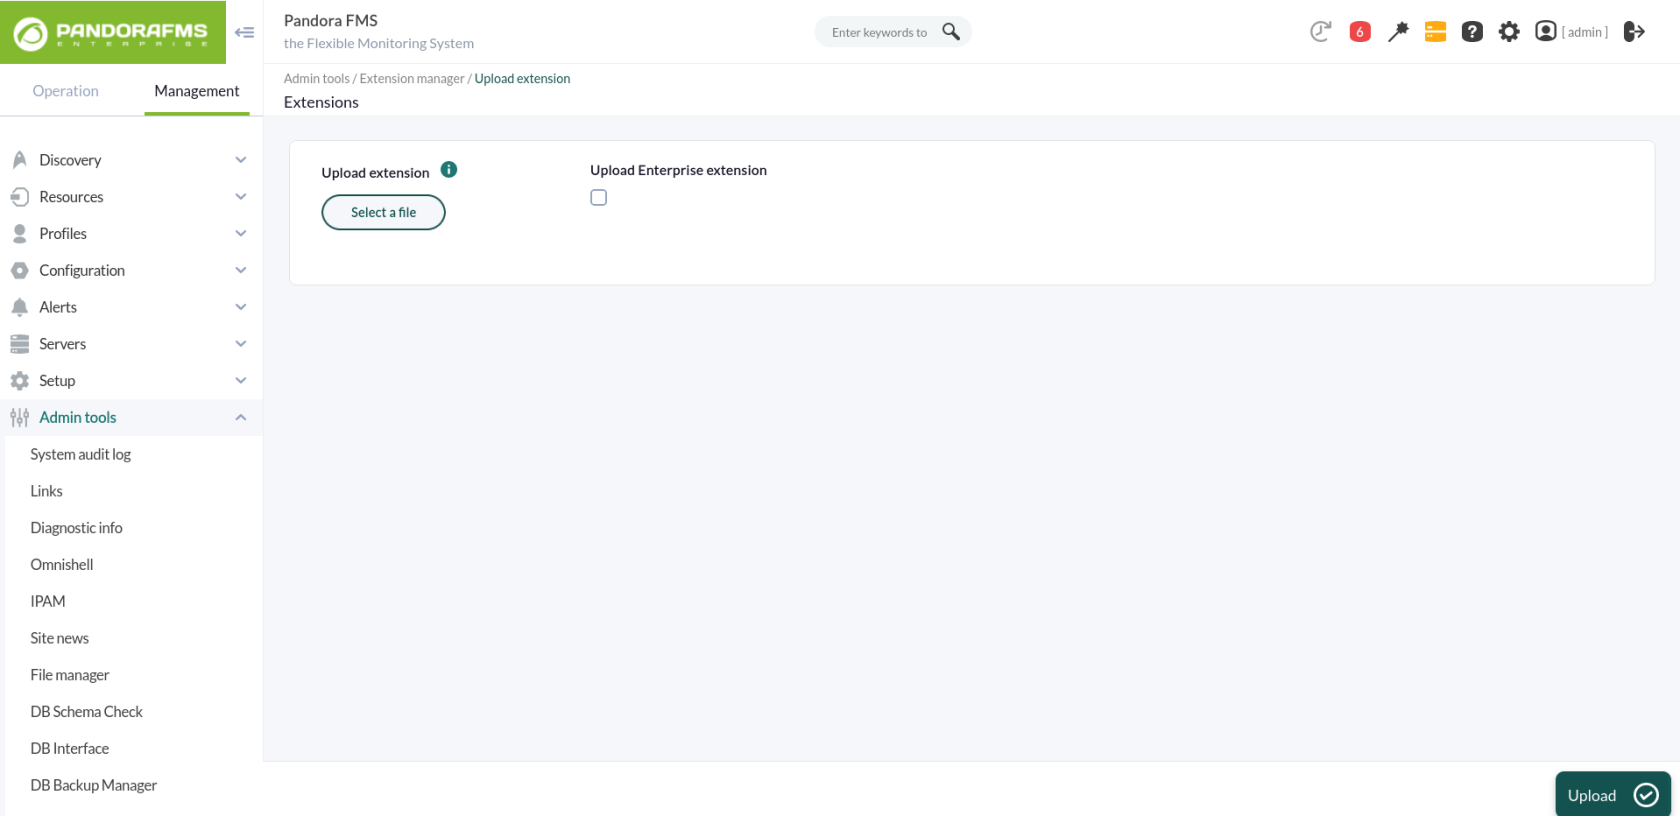
 It is important not to check the “Upload enterprise extension” option.
In short, these steps basically locate the contents of the ZIP file in the extensions directory of Pandora FMS console, which will lead to the directory being created:
/var/www/html/pandora_console/extensions/grafana
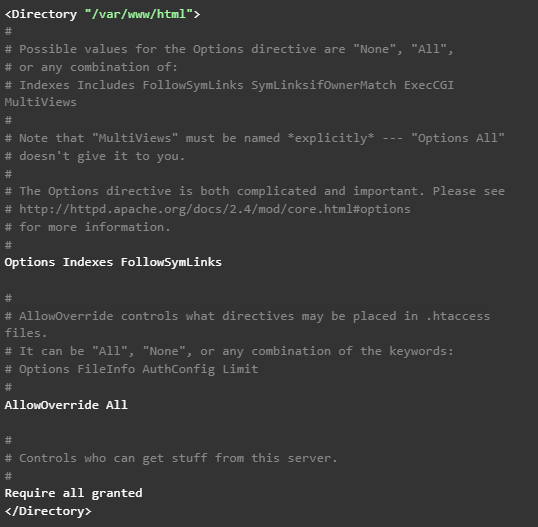
If, as in this case, the installation is based on a Pandora FMS ISO, it will also be necessary to modify a configuration parameter of the Apache server.
Just edit the file /etc/httpd/conf/httpd.conf, and set the parameter “AllowOverride none” as “AllowOverride All”, within the directives of the block ‘’ since that is where Pandora FMS console is located. Therefore, it should be this way:
It is important not to check the “Upload enterprise extension” option.
In short, these steps basically locate the contents of the ZIP file in the extensions directory of Pandora FMS console, which will lead to the directory being created:
/var/www/html/pandora_console/extensions/grafana
If, as in this case, the installation is based on a Pandora FMS ISO, it will also be necessary to modify a configuration parameter of the Apache server.
Just edit the file /etc/httpd/conf/httpd.conf, and set the parameter “AllowOverride none” as “AllowOverride All”, within the directives of the block ‘’ since that is where Pandora FMS console is located. Therefore, it should be this way:
 Also add a parameter in the PHP settings. Add the following line at the end of the file /etc/php.ini: serialize_precision = -1
And for these changes to go into effect, the Apache service must be restarted:
Also add a parameter in the PHP settings. Add the following line at the end of the file /etc/php.ini: serialize_precision = -1
And for these changes to go into effect, the Apache service must be restarted:
2. Loading Pandora FMS plugin for Grafana
Upload the ZIP file to the Grafana server with all the plugin files and place it in the path “/var/lib/grafana/plugins”. Unzip the file on this path with the “unzip” command and restart the Grafana service to load it: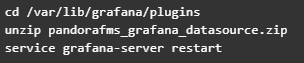

3. Configuring Pandora FMS as data source for Grafana dashboards
Add the following lines to the end of the Grafana configuration file (/etc/grafana/grafana.ini):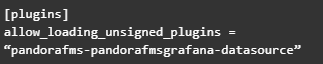
 After this change is applied, the Grafana service must be restarted using the following command: service grafana-server restart
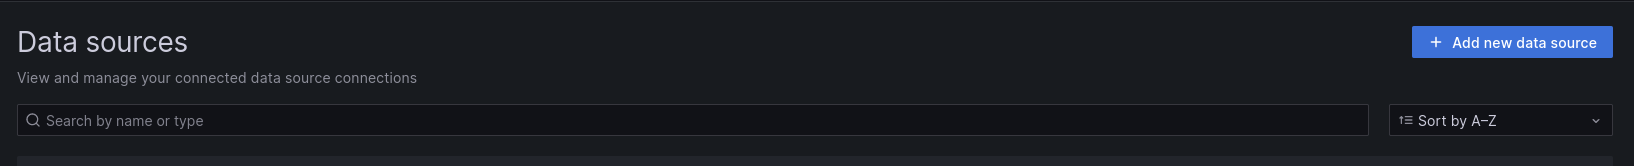
At this point, what you have to do is configure the plugin uploaded in Grafana so that it connects to the extension loaded in Pandora FMS and allows you to use its data in Grafana dashboards.
Access the “Configuration > Datasources” menu in Grafana and click on the “Add datasource” button:
After this change is applied, the Grafana service must be restarted using the following command: service grafana-server restart
At this point, what you have to do is configure the plugin uploaded in Grafana so that it connects to the extension loaded in Pandora FMS and allows you to use its data in Grafana dashboards.
Access the “Configuration > Datasources” menu in Grafana and click on the “Add datasource” button:
 You will see different plugins that you may configure, and at the bottom of the list, you will see the plugin that you just loaded for Pandora FMS. Click on it:

 This will take you to a form where you only need to fill out 3 fields for the connection with the Pandora FMS extension:
- URL to the extension, which according to the suggestion we will see will be (by default) “http://x.x.x.x/pandora_console/extensions/grafana”, where “xxxx” is the IP address or DNS name to your Pandora FMS console.
- Pandora FMS user, which will allow you to obtain data for Grafana dashboards. This user must have at least agent read permissions (AR) and can only obtain data from those agents on which it has permissions.
- Pandora FMS user password.


What happens if it does not work properly?
In configuration you might see different errors, such as:- HTTP Error Bad Gateway → If Grafana could not connect to Pandora FMS or if the indicated IP address was incorrect.
- HTTP Error Not Found → If the indicated URL was not correct, for example because Pandora FMS extension was not correctly loaded or just because of an error when typing in the URL in the form.
- Datasource connection error: Unauthorized → If the user and/or password indicated were not correct or if the user did not have the minimum agent read permissions (AR).
Create your first Dashboard in Grafana
First, go to the “Create > Dashboard” menu, and in the board that will appear, click “Add query”: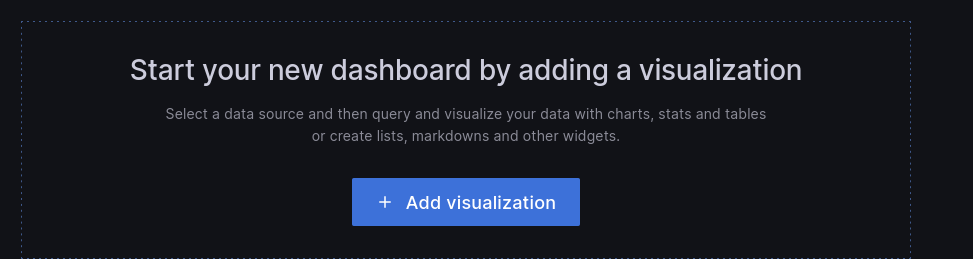
 This will take you to a form where to choose your “Pandora FMS” data source in the “Query” drop-down. This will make the bottom of the form change and you will see a query to choose a module from which to display the data on the board:
- Label: It will allow you to specify the tag that you wish for the data represented for this query to have.
- Group: It is used to filter the agent about which to represent data. A group must be chosen.
- Agent: It is used to filter the module about which to represent data. Some agent must be indicated.
- Module: It is used to specify exactly the module about which to represent data.
- TIP: It is a field that will allow to indicate whether the data to be represented will be compacted or not. If unchecked, the data will be compacted, which will result in easier-to-interpret and faster-loading graphs, although the data sample will not be the actual one but rather an average.
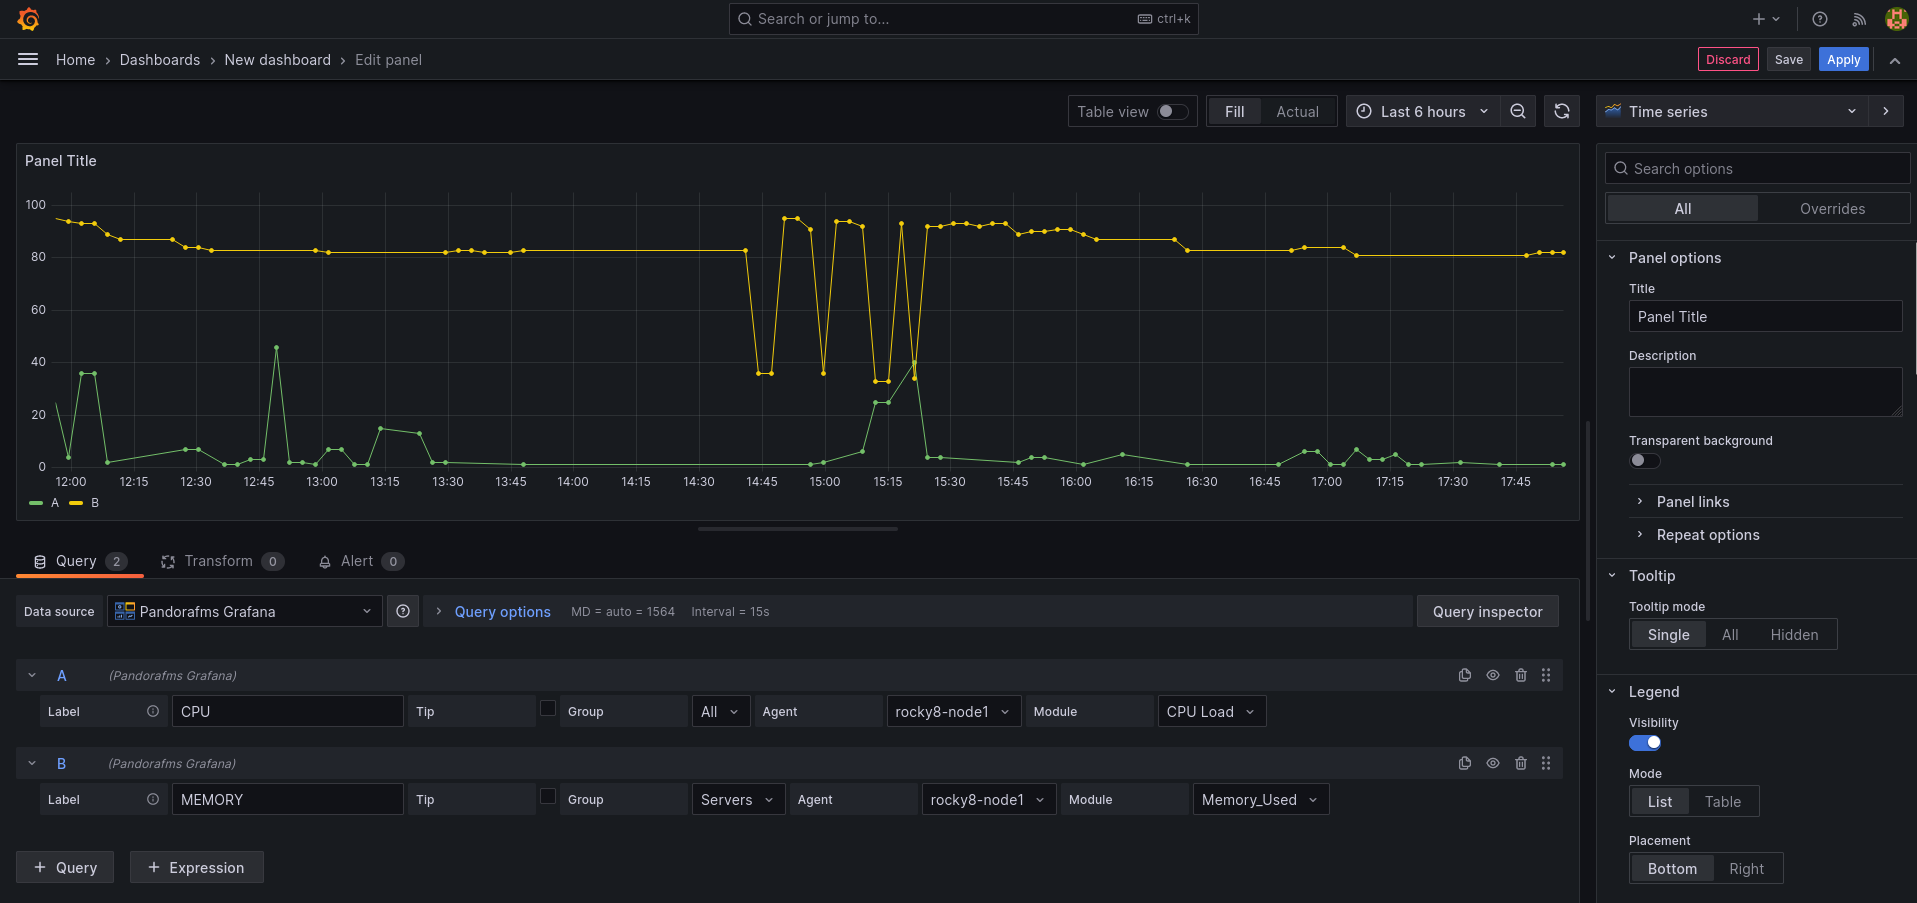
 And you may also add more boards within the same Grafana dashboard, so that you have all the necessary information on the same screen.
Create your first alarm in Grafana
You may create an alert from the “Alert” menu, in the dashboard display (once the Dashboard is saved).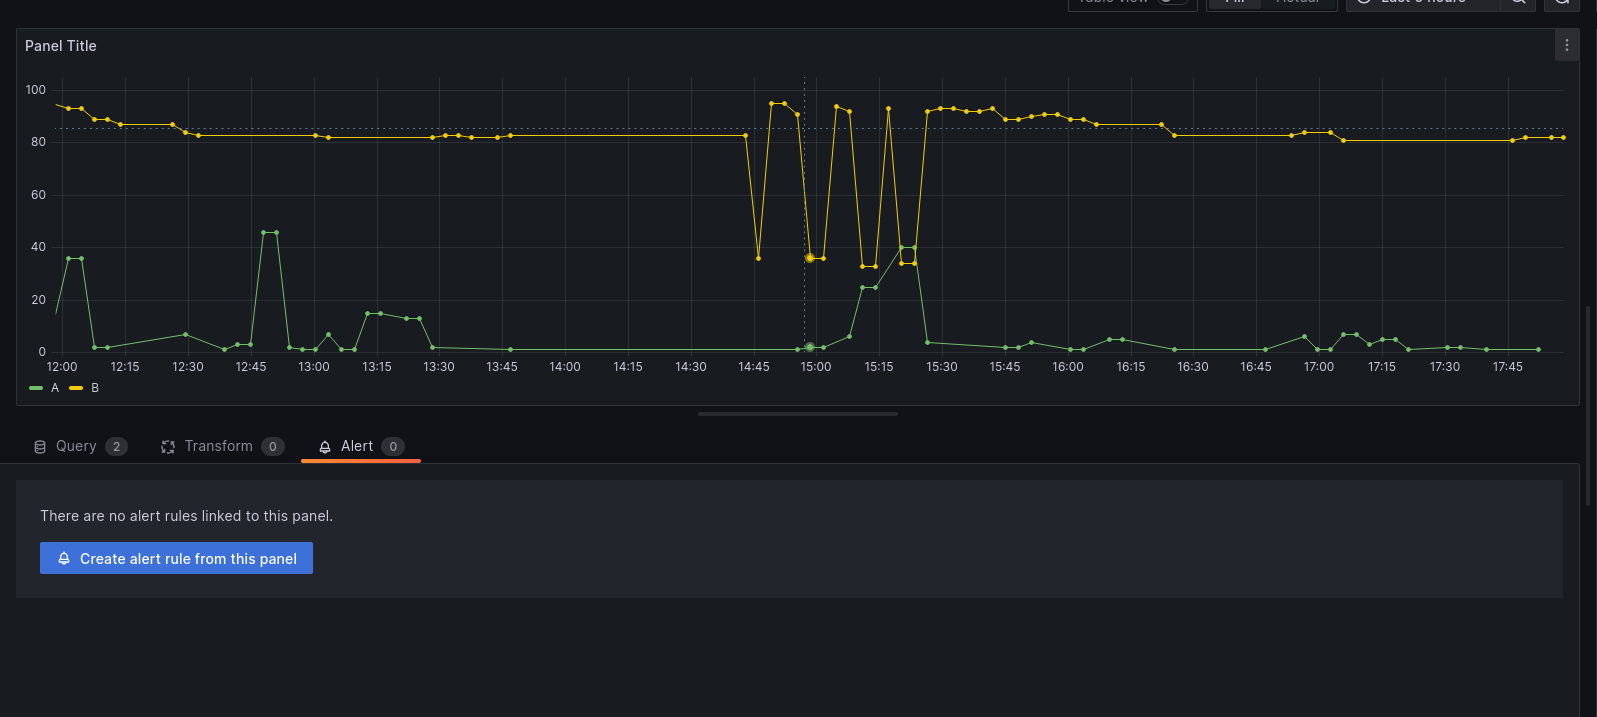
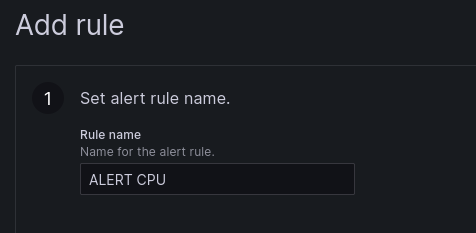
 In this menu, adjust a few rules to configure your alert:
1 . Set the name of the alert rule.
In this menu, adjust a few rules to configure your alert:
1 . Set the name of the alert rule.
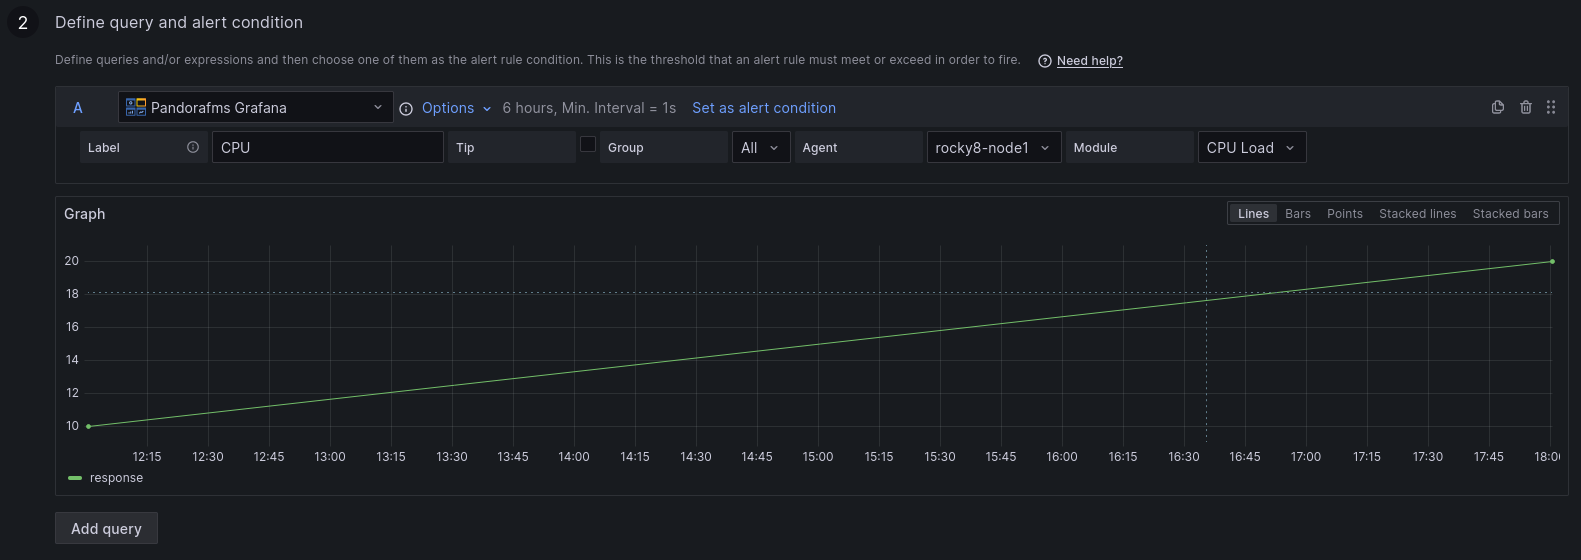
 2. Define the query and the alert condition.
 3. Establish alert evaluation behavior.

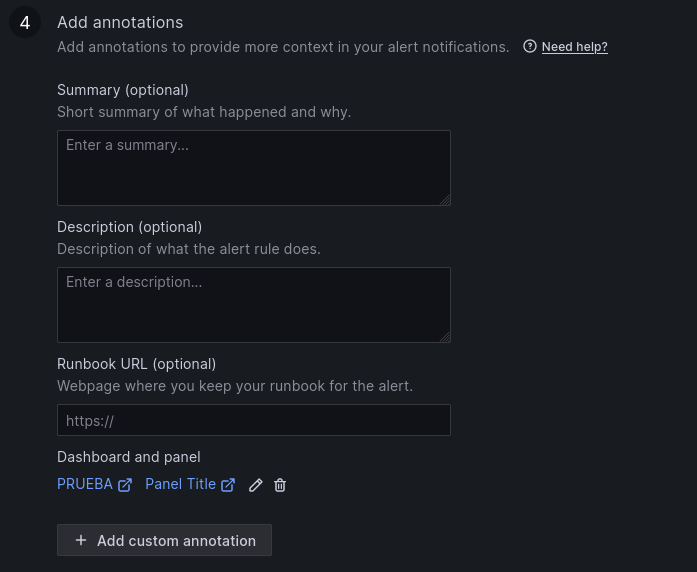
 4. Add notes.
 5. Set up notifications.

 Once the alert is configured and saved, you may see it in the dashboard: