


Introduction
Some people working as a SOC (Security Operation Center) relaying on the tools/solutions they are using in the first place for monitoring. But, some times you will need to do your own tool & automation to help you on the way you work or thinking “Your mindset”. So, this blog will explain how to use python with Scapy library along with tcpdump to analysis our network traffic & we will write an automation to detect port scanning as i will be performing the attack on the lab that contains 2 machines (Virtual Lab) first machine is the Attacker(Parrot OS) machine & the second is the Victim(Ubuntu).
Why Python and Scapy ?
As we all know Python is widely used and the reason to choose it, Is the easy syntax. It’s not effective language in performance for sure like C/C++,Go,Rust, etc.. But, it will not be complicated for these who want to use the easy way. Why specially Scapy and not other libraries ?. Basically, the Scapy library is so powerful and effective in manipulate, attack & scan networks “Low-Level library”. It’s easy to use and play with the large features. The most great thing about it is a widely used library and documentation for Scapy. Therefore, I will explain for you all the important usage for the library that you would need.
Capture the traffic
Now, we will set both of the machines to Host-Only adapter to avoid any other additional & junk traffic on the network. So, we got the attacker machine with the following IP 192.168.11.130 and the Victim machine with the following IP 192.168.11.131. We will perform some Port Scanning to discover the used services by the Victim machine, While we are running tcpdump on it to capture the network traffic will be generated by our actions. Let’s run tcpdump using the following command tcpdump -i <Interface> -w file_name.pcap.

Basically, the -i is to identify which interface the tcpdump will work on and -w to write the captured traffic into a file “You have to give the file name as a value”. Now, time to simulate our attack on the victim.
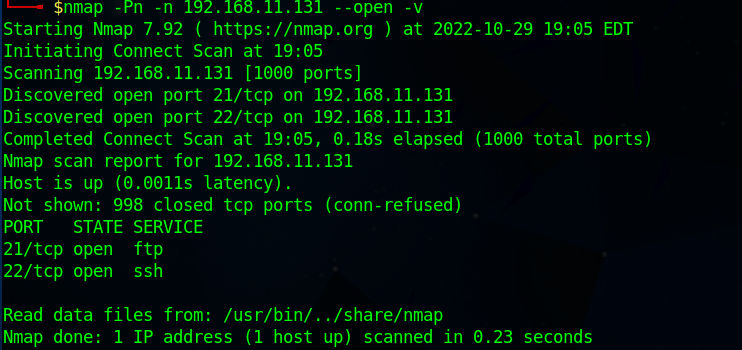
In the above picture we perform a Port Scanning using Nmap. As explain for the command in the screenshot:
-Pn: Disable ping request to the target.-n: Disable DNS resolution.--open: Display only open ports.-v: For verbose.
Results show us that FTP & SSH services are running.
The reason why i disabled the ping and dns requests is to reduce the traffic & You could use nmap just to scan the 21/ftp port also, 22/ssh port using the -p option and give it the ports you wish to scan and separate it by , (e.x:-p 21,22,80,8080).
Read the traffic with
It’s the moment to analysis the traffic we captured. First, turn off tcpdump using CTRL+C keys. And after listening the files you will be able to see our captured file whicc is traffic.pcap as we saved.

Before we start we need python3 & Scapy package installed. You can install Scapy using pip as the following pip install scapy. Also, you can use a text editor for your code or an IDE, I am going to use Pycharm during this blog. let’s run our IDE and start coding.
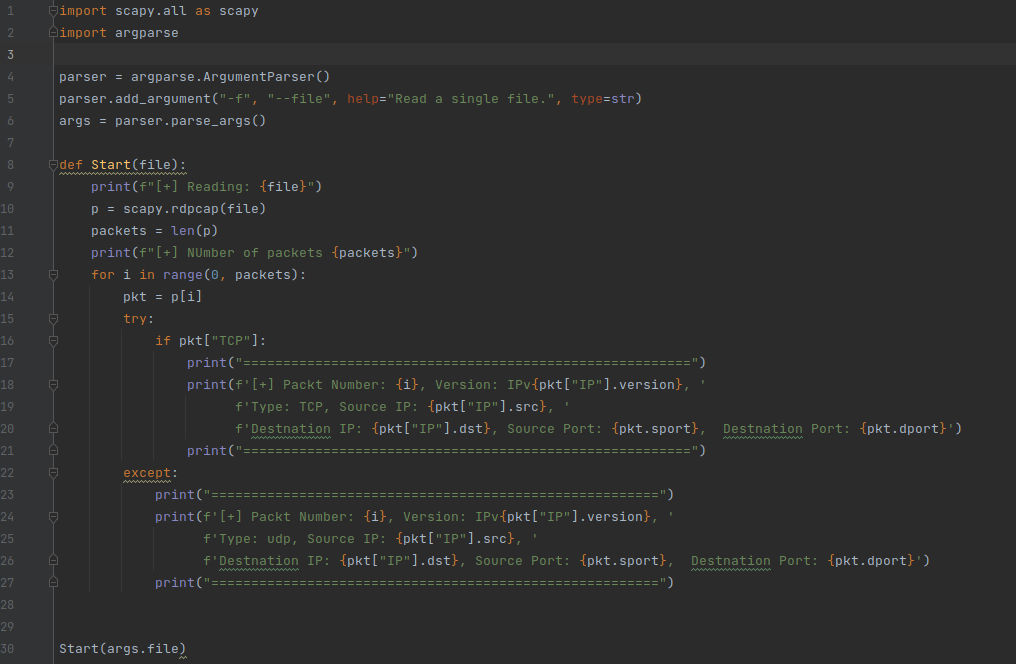
So, Lets explain the above code to understand the basics of Scapy.
import scapy.all as scapy
import argparse
Here we import the libraries we do need, I imported Scapy as it’s the main one for our topic & i used argparse to parse the input using command line arguments.
parser = argparse.ArgumentParser()
parser.add_argument("-f", "--file", help="Read a single file.", type=str)
args = parser.parse_args()
We created our parser now and added an argument with type String. Then, we make the argument -f or --file. Then we parsed the arguments of our parser in args variable.
After that we created a function and naed it Start() and it takes one argument called file which gonna be the file path we will provide to analysis & read the data from the pcap file. Now, the actual code inside our Start() function.
print(f"[+] Reading: {file}"): Print the file path we provided.p = scapy.rdpcap(file): Start read thepcapfile and store it insidepvariable.packets = len(p): Get the length of thepcapfile we have read which is also the number of packets and we stored it intopacketsvariables.print(f"[+] NUmber of packets {packets}"): Print the number of packets.
The following lines we created a for loop in range of packets number, that starts from index 0 to the packets number.
pkt = p[i]: Variablepktto store the packet which the index isireferees to the packet number in the packets.
Now, to explain the rest of the code we need to under stand the format of the packets in Scapy & how its parsing them. So, we are going to use Scapy from the command Line Interface to explain it.
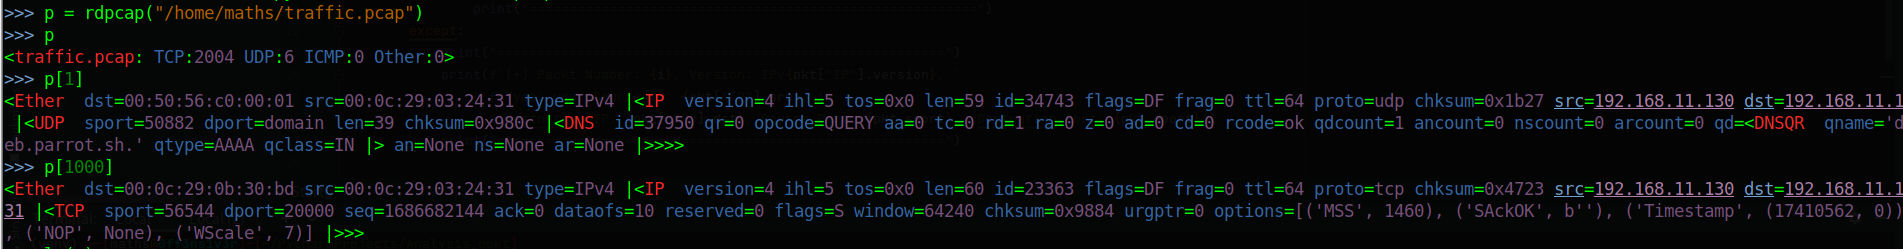
In the above picture we read the pcap file through the Command Line Interface for Scapy inside p variable and then we executed it and got the following output <traffic.pcap: TCP:2004 UDP:6 ICMP:0 Other:0>. It tells you information about the packets inside the file like: “Numbers of TCP,UDP, ICMP & others packets”. Now, if we try to show one of the packets for example packet number 1 using p[1] we will get the following results:
<Ether  dst=00:50:56:c0:00:01 src=00:0c:29:03:24:31 type=IPv4 |
<IP  version=4 ihl=5 tos=0x0 len=59 id=34743 flags=DF frag=0 ttl=64 proto=udp chksum=0x1b27 src=192.168.11.130 dst=192.168.11.1 |
<UDP  sport=50882 dport=domain len=39 chksum=0x980c |
<DNS  id=37950 qr=0 opcode=QUERY aa=0 tc=0 rd=1 ra=0 z=0 ad=0 cd=0 rcode=ok qdcount=1 ancount=0 nscount=0 arcount=0 qd=<DNSQR  qname='deb.parrot.sh.' qtype=AAAA qclass=IN |> an=None ns=None ar=None |>>>>
Explainig the output:
Ether: Layer 2 captured data like MAC address.IP: Layer 3 captured data like Source & Destination address.UDP: Layer 4 Used protocol and the Source & Destination ports.
The rest are additional information according to the service used and the packet data. Also, theUDPcould beTCPdepending on the used type. For example the following packet is aTCPpacket.
<Ether  dst=00:0c:29:0b:30:bd src=00:0c:29:03:24:31 type=IPv4 |
<IP  version=4 ihl=5 tos=0x0 len=60 id=23363 flags=DF frag=0 ttl=64 proto=tcp chksum=0x4723 src=192.168.11.130 dst=192.168.11.131 |
<TCP  sport=56544 dport=20000 seq=1686682144 ack=0 dataofs=10 reserved=0 flags=S window=64240 chksum=0x9884 urgptr=0 options=[('MSS', 1460), ('SAckOK', b''), ('Timestamp', (17410562, 0)), ('NOP', None), ('WScale', 7)] |>>>
Why we needed to know this ?, Cause when you want informations from the packet you have to specify the Layer you want data from and what data do you want for instance, You want the Destination port. So, we gonna fetch it as this packet["TCP"].dport. (packet["Layer"].key).
Now, Back to the rest of our code. we made an exception here in the following code:
First, it’s gonna try to check if the packet is TCP and will print the packet information with type TCP. If not the exception will print it as UDP type.
try:
    if pkt["TCP"]:
        print("========================================================")
        print(f'[+] Packt Number: {i}, Version: IPv{pkt["IP"].version}, '
              f'Type: TCP, Source IP: {pkt["IP"].src}, '
              f'Destination IP: {pkt["IP"].dst}, Source Port: {pkt.sport},  Destination Port: {pkt.dport}')
        print("========================================================")
except:
    print("========================================================")
    print(f'[+] Packt Number: {i}, Version: IPv{pkt["IP"].version}, '
          f'Type: udp, Source IP: {pkt["IP"].src}, '
          f'Destination IP: {pkt["IP"].dst}, Source Port: {pkt.sport},  Destination Port: {pkt.dport}')
    print("========================================================")
The information that will be printed:
Packt Number: {i}: Packet number.pkt["IP"].version: IP versionv4/v6.pkt["IP"].src: Source IP.pkt["IP"].dst: Destination IP.pkt.sport: Source Port.pkt.dport: Destination Port.
Running the code and the results:

Here we do grep from the shell to get the lines contain udp which are the UDP packets and it’s include all the information we added to the could to be printed.
Manual Analysis for Port Scan traffic
After all what we go through. Now, it’s the time to analysis our captured file manually using wireshark to see how the port scanning we performed is working and the traffic of the opened & closed ports. Then, we will use Scapy to automate the detection of port scanning. run wireshark from the command line and provide the file to it wireshark file.pcap
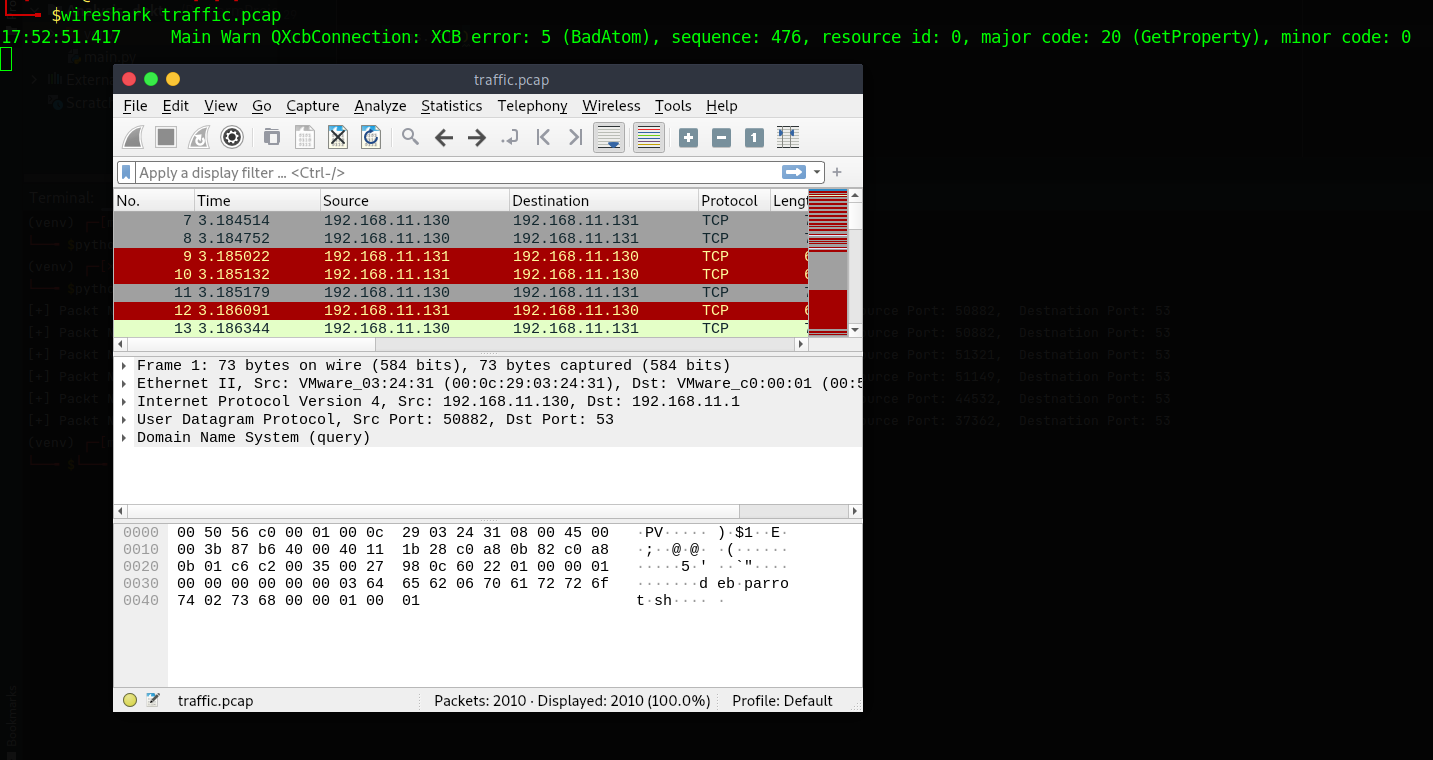
we can see a big traffic and to make the analysis more easy we gonna to compare the open ports traffic with the closed one.

Using the tcp.port==22 will show us traffic of port 22 which is SSH protocol. We can see that the attacker 192.168.11.130 connecting to 192.168.11.131 which is the victim on port 22 as the following:
- Attacker Sends connection request on port
22along withSYNflag
Attacker => SYN => Victim- Victim response with
SYN/ACKflags which means the port is open
Victim => SYN/ACK => Attacker- Attacker send
ACKflag which now is fully connected and can start use the service
Attacker => ACK => Victim- At the end attacker send
RST/ACKwhich will close the connection with the victim
Attacker => RST/ACK => VictimThe above analysis was for an open port. So, let’s see how is it for a closed one for example one of the ports we know it’s closed like 8080 let’s filter it out using tcp.port==8080.

- Attacker Sends connection request on port
8080along withSYNflag
Attacker => SYN => Victim- Victim Response
RST/ACKwhich means that no open ports
Victim => RST/ACK => AttackerAfter we knew the behaviour for both open/closed ports in the traffic. Therefore, Let’s automate the detection.
Automated Analysis & Detection
From what we understand in the manual analysis we can check the flags for ports packets detect port scanning by analysis the attempts of connection on different ports. So, lets take the short path and search for failed connections in the packets and see if it’s for the same IP.
import scapy.all as scapy
import argparse

parser = argparse.ArgumentParser()
parser.add_argument("-f", "--file", help="Read a single file.", type=str)
args = parser.parse_args()

flag = []

def check_flags(attacker, server, port):
    if flag[0] == "S" and flag[1] == "RA":
        print(f'[!] Failed connection: {attacker} ====> {server}:{port}')


def Start(file):
    print(f"[+] Reading: {file}")
    p = scapy.rdpcap(file)
    packets = len(p)
    print(f"[+] NUmber of packets {packets}")

    for port in range(0, 65536):
        for i in range(0, packets):
            pkt = p[i]

            try:
                if pkt.sport == port or pkt.dport == port:
                    if pkt.dport == port:

                        flag.append(str(pkt["TCP"].flags))
                    elif pkt.sport == port:
                        flag.append(str(pkt["TCP"].flags))
                        check_flags(pkt["IP"].dst, pkt["IP"].src, port)
                        flag.clear()

            except:
                pass


Start(args.file)
The code will print the failed packets that try to connect to a closed port and print us out the results.
Let’s explain the code:There are some parts of the code are the same to the above one. So, Just the new added lines will be explained
flag= []: created array.for port in range(0, 65536):A for loop in range of all the ports number in the exist. The following lines we created a for loop in range ofpacketsnumber, that starts from index0to thepacketsnumber. Therefore, we gonna take all packets and check if theSource Portor DestinationPortin it is equal to our port number. Then, as the DestinationPortis the first sent in the packet which will carry theSYNflag with it as a try to connect to this port, we gonna save it’s flag in the array first. Aبter that we save the flag coming from theServerwhich come on the same port as aSource Port. then we call the functioncheck_flagsand pass the arguments to it. What this function do is the following:
def check_flags(attacker, server, port):
    if flag[0] == "S" and flag[1] == "RA":
        print(f'[!] failed connection: {attacker} ====> {server}:{port}')
This function is taking 3 arguments which is the Attacker IP, Server IP & the port number. After that it checks if the first & second elements of the array flag is equal to S & RA
Which means a failed connection on a closed port.
flag.clear(): clear the array after check.
Running the script:
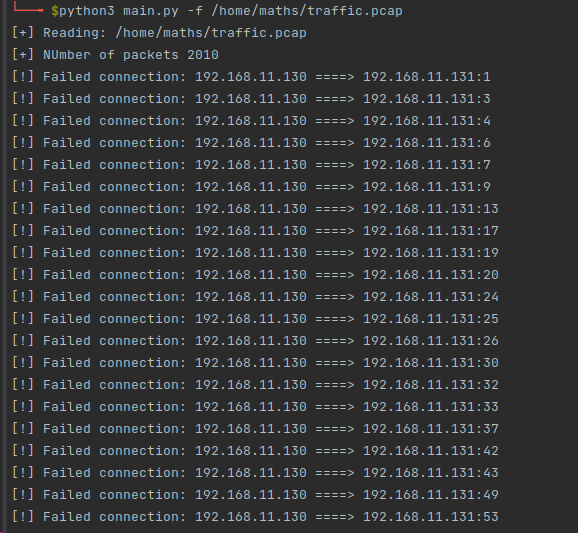
As you can see a lot of failed connections from the same IP address on different ports. If you look clearly on the picture. You will see that port 22 not here cause it’s an open port and created a success connection.
Conclusion
At the end Port Scanning has a lot of types and what we saw in the blog was just an example. I would recommended that you go though Scapy documentation and try to perform different scanning types on your environment and analysis the traffic manually then automate it. Therefore, you will be able to detect that scan type.
#python #network #scanning #nmap
