Skip to content

CVE-2021-45456 Apache Kylin RCE Exploit

Introduction

This is an exploitation script written in Python to exploit #Apache #Kylin Command Injection #CVE-2021-45456 and get RCE.

You can find the script here: https://github.com/mhzcyber/CVE-Analysis/blob/main/CVE-2021-45456/CVE-2021-45456Exploit.py

To understand more about the CVE, you can check the previous PoC and Analysis blog that we published.

Testing Lab

The lab here is the same as the one mentioned in the analysis blog, but we will add a minor modification.

Since this is a docker container, it’s minimalized with the requirements only to run the solution.

Usually, we have more features to abuse in the system, for example, netcat or nc, so we are going to install nc.

  • Access the container using the following command:

sudo docker exec -it container_id bash

  • Install nc

yum install nc -y

Exploitation Script

We are going to start by explaining the script

  • The script starts with defining the libraries

create_project function

  • After that, we have the create_project function, where we create a project and inject the malicious payload.

The function takes the following args host, lhost, lport, username, password

Those args are entered by the user when running the script.

This line checks if there is “.” in the lhost and removes them.

so if the lhost is 172.17.0.2 the result is 1721702

if "." in lhost:
        lhost = lhost.replace(".", "")

structuring the URL

url = f"http://{host}/kylin/api/projects"

takes the username and password and encodes them with base64 to create basic auth.

auth_header = f"Basic {base64.b64encode(f'{username}:{password}'.encode('ascii')).decode('ascii')}"

Structuring the headers, and the project data which includes the name, description ..etc, we have also the project_desc_data with is the project data but in a JSON format

Proxy setting to be able to intercept the requests from the script

Send the HTTP request, and check for the error message if the project already existed.

If the HTTP code is 200 which means the request success

It will retrieve the jsessionid

If there’s some other error it will be printed and it will return none

trigger_diagnosis function

The function takes those args host, jsessionid, lhost, lport

all entered by the user except jessionid returned from create_project function.

Structuring the project_name i.e. the malicious payload, the URL to trigger the exploitation, and the headers.

Proxy setting to be able to intercept the requests from the script

Send the request, if it’s 200 OK, it will print “[+] Request is successful.”

otherwise, it will print the error code.

Here’s a banner with usage instructions and example.

Unless there are 5 args entered, the tool will exit.

The returned value of jsessionid from create_project function is stored in the variable jsessionid

it checks if jsessionid variable is not none and has the value false, it runs the trigger_diagnosis function. otherwise, it will quit.

Run the exploitation script

I’m going to run the exploit and use the proxy to intercept the requests in burpsuite demonstrating better understanding.

  • This is the create_project function request

  • This is the trigger_diagnosis function request

  • Received a connection and gained access

Video of the exploitation tool from here:

https://youtu.be/gg8Qrs-zo_E

About Version 2 Digital

Version 2 Digital is one of the most dynamic IT companies in Asia. The company distributes a wide range of IT products across various areas including cyber security, cloud, data protection, end points, infrastructures, system monitoring, storage, networking, business productivity and communication products.

Through an extensive network of channels, point of sales, resellers, and partnership companies, Version 2 offers quality products and services which are highly acclaimed in the market. Its customers cover a wide spectrum which include Global 1000 enterprises, regional listed companies, different vertical industries, public utilities, Government, a vast number of successful SMEs, and consumers in various Asian cities.

About VRX
VRX is a consolidated vulnerability management platform that protects assets in real time. Its rich, integrated features efficiently pinpoint and remediate the largest risks to your cyber infrastructure. Resolve the most pressing threats with efficient automation features and precise contextual analysis.

CVE-2021-45456: Apache Kylin Command Injection

Introduction

Command injection in #Apache #Kylin has been found and registered as #CVE-2021-45456 Apache Kylin is an open-source distributed analytics engine designed to provide a SQL interface and multi-dimensional analysis on Hadoop and Alluxio supporting extremely large datasets. It was originally developed by eBay, and is now a project of the Apache Software Foundation.

Background Story

The basic story behind this vulnerability is that the user can create a project, and dump diagnosis information of that project. in order for the solution to dump the diagnosis information it executes a script. Since the project name is controlled by the user, the user can enter the project name as a Linux command but without characters or spaces, after that When the user sends the request of the diagnosis, can modify the project name (i.e. the Linux command) and add spaces and other needed characters but URL-encoded so the command will be a valid command. The solution will process this request, decode the project name, and treat it as a Linux command in the execution process, therefore, it will execute the malicious payload.

Build the lab

I’m using docker on Ubuntu server 20.04

Install docker

  • apt update
  • apt install docker docker-compose

Install Apache Kylin

  • docker pull apachekylin/apache-kylin-standalone:4.0.0  
  • sudo docker run -d \ -m 8G \ -p 7070:7070 \ -p 8088:8088 \ -p 50070:50070 \ -p 8032:8032 \ -p 8042:8042 \ -p 2181:2181 \ -p 1337:1337 \ --name kylin-4.0.0 \ apachekylin/apache-kylin-standalone:4.0.0

Setup the debugger

First, configure the kylin.sh file
  • docker exec -it container_id bash
  • file path /home/admin/apache-kylin-4.0.0-bin-spark2/bin/kylin.sh
  • Under the retrieveStartCommand() function which is the start command function. line number 267
  • Scroll down to line number 307, the line starts with the following $JAVA ${KYLIN_EXTRA_START_OPTS} ${KYLIN_TOMCAT_OPTS}
  • Add the following -Xdebug -Xrunjdwp:transport=dt_socket,server=y,suspend=n,address=1337
  • Restart the container docker container restart container_id
  • Login to Kylin, port is 7070. I’m using the docker ip, you can also use the localhost IP.
  • Creds admin:KYLIN
  • Configure the debugger in Intellij IDEA

Reproduce the vulnerability

Based on the advisory, we will create a project with command injected e.g. touchpwned and after that, we will dump the diagnosis information for the project, but while we are doing this we will modify it using burpsuite to trigger the command injection, therefore, triggering the exploit.
  • Once you click “Diagnosis”, intercept the request
  • Change the name touchpawned to %60touch%20pawned%60 which the URL-encoded result of the following:
    `touch pawned`
  • Now, check the container
We demonstrated how you can gain access to the target and leverage this to RCE in the PoC blog from here: https://www.vicarius.io/vsociety/blog/cve-2021-45456-apache-kylin-rce-poc

Static Analysis & Debugging

NOTE: to run Kylin solution you run other apache solutions along with it, and this includes spark, Kafka, hbase, hive, spring …etc. therefore the debugging won’t be as detailed as usual because it will take it us into the source code of the other solutions.

Find an entry point

Based on the advisory the vulnerability happens in dumpProjectDiagnosisInfo method, but I want to go through how it handles the request, how the project gets created, how the name got stored, and how the vulnerability gets triggered with the latest request we saw.
  • I searched for “projects” and found the “ProjectController.java”. This class here responsible for listing all projects, saving the project, updating the project, deleting the project, updating the project owner, and basically most of the project functions.
  • I set a few breakpoints as you can see and I created a new project called “test1”, you can see this in projectDescData variable the values of the project.

Understand how the project gets created and saved

  • So first time we create a project, the solution will use the saveProject method. Let’s go through this method real quick.
The method handles a POST request to create a new project instance.
  • @RequestMapping(value = "", method = { RequestMethod.POST }, produces = { "application/json" }): This line is an annotation that maps the method to the endpoint for creating a new project instance. It specifies that the endpoint should accept a POST request with an empty URL and that it should produce a JSON response.
  • @ResponseBody: This annotation is used to indicate that the method’s return value should be written directly to the response body.
  • public ProjectInstance saveProject(@RequestBody ProjectRequest projectRequest): This line defines the method signature, which includes a ProjectRequest object as the request body and returns a ProjectInstance object.
  • if (StringUtils.isEmpty(projectDesc.getName())): This line checks whether the name field of the ProjectInstance object is empty.
  • if (!ValidateUtil.isAlphanumericUnderscore(projectDesc.getName())): This line checks whether the name field of the ProjectInstance object contains only alphanumeric characters and underscores.throw new BadRequestException(: If the name field does not contain only alphanumeric characters and underscores, a BadRequestException is thrown.
ProjectInstance createdProj = null;
        try {
            createdProj = projectService.createProject(projectDesc);
        } catch (Exception e) {
            throw new InternalErrorException(e.getLocalizedMessage(), e);
        }
This snippet here creates a new ProjectInstance object named createdProj and sets it initially to null. It then tries to create a new project using a projectService object and the projectDesc parameter passed to the createProject method. If the project creation is successful, the createdProj object will be assigned the newly created project instance. If an exception is thrown during the project creation process, the catch block will be executed.
  • return createdProj;: This line returns the createdProj object, which contains the newly created project instance

How the diagnosis request get proceeded & how the command gets executed

  • It all starts from the dumpProjectDiagnosisInfo method, set the breakpoints.  
  • Now click on “Diagnosis” in the website. you can always see variables and their values right there.  
  • The important line for me is the following String filePath = dgService.dumpProjectDiagnosisInfo(project, diagDir.getFile());
  • We have here the dumpProjectDiagnosisInfo , now follow this and you will find yourself in DiagnosisService.java file
You can see the path here which is supposed to be the path of the diagnosis data.
  • Keep following with the debugger, now this is another interesting
String[] args = { project, exportPath.getAbsolutePath() }; This is an array named args and it contains the project name along with the exportPath which is the diagnosis data path and it’s using the getAbsolutePath() method. The getAbsolutePath() method is a part of the File class. This function returns the absolute pathname of the given file object.
  • After that we see runDiagnosisCLI(args) takes the args array as input.
  • Step-in, and here is the runDiagnosisCLI() method, and we can see the args with the values right there.  
After that we couple of loggers. from there, we go to File script = new File(KylinConfig.getKylinHome() + File.separator + "bin", "diag.sh"); This line of the method creates a new File object representing a shell script named “diag.sh” located in the “bin” directory of the Kylin configuration directory. If the script does not exist, the method throws a BadRequestException with a message that indicates the file could not be found.
  • Now, we have diagCmd variable which has the script path and the args.
  • Step-in, and click getCliCommandExecutor()
  • This will take you to getCliCommandExecutor and this method determines if it will get the remote access configuration of a Hadoop cluster or not to execute commands on it, i.e. remote commands. if the value retrieved is null in regards to the remote access configuration of the Hadoop cluster, and this is what happened in our case, the commands will be executed locally.
  • You can see the value of executor returned
We have here kinda two versions of the execute method in the CliCommandExecutor calls. both of the methods execute a shell command and return a Pair object containing the exit code and output of the command. We can see the first execute method takes only one argument: String command. Then, it calls the second execute method with the same command argument, along with a default logAppender of new SoutLogger() and a jobId of null. The second execute method takes the command, a logAppender (which is a logger instance that is used to log the output of the command), and a jobId (which is an optional identifier that can be used to track the execution of the command). The method then checks if a remote host has been specified for the CliCommandExecutor instance. If not, it runs the command locally using the runNativeCommand method, passing in the command, logAppender, and jobId. This method executes the command using a ProcessBuilder and captures the output and exit code of the command. If a remote host has been specified for the CliCommandExecutor instance, the execute method instead runs the command on the remote host using the runRemoteCommand method. Finally, the method checks the exit code of the command. If the exit code is non-zero, the method throws an IOException with an error message containing the exit code, error message, and command itself. Since we know that the command execution will happen locally, I added new breakpoints Step-in to follow runNativeCommand method since it’s the method that will execute the command. Obviously, the code defines a private method runNativeCommand which is called by the execute method in the same class, and it executes a shell command using ProcessBuilder and returns a Pair object containing the exit code and output of the command. The method takes three arguments: command (which is the shell command to be executed), logAppender (which is a logger instance that is used to log the output of the command), and jobId (which is an optional identifier that can be used to track the execution of the command). The method first constructs an array cmd of strings, which contains the command and its arguments. The cmd array is constructed differently depending on the operating system: for Windows, the command is executed using cmd.exe /C, while for other operating systems (such as Linux or macOS), the command is executed using /bin/bash -c. Then, the method constructs a ProcessBuilder instance using the cmd array and sets the redirectErrorStream property to true, which means that any error messages produced by the command will be redirected to the same output stream as the command’s standard output. The method then starts the process using ProcessBuilder.start() and registers it with a JobProcessContext if a jobId is provided. The method then reads the command’s standard output line by line using a BufferedReader, and appends each line to a StringBuilder. For each line, if a logAppender is provided, the line is logged using the Logger.log() method. If the method is interrupted by another thread (as determined by Thread.interrupted()), it destroys the process and returns a Pair object with an exit code of 1 and a message of “Killed”. If the command execution completes successfully, the method waits for the process to exit using Process.waitFor() and returns a Pair object with the exit code and output of the command. Finally, the method checks if the jobId is not null removes the process from the JobProcessContext . You can see from here how the variables get set along the execution of the software. Those are all the variables after the runNativeCommand is done. From here it will return to r = runNativeCommand(command, logAppender, jobId); and now it’s a matter of sending the command output back in the response.

How the execution looks like with an injected malicious payload

Since we understood in-depth how everything gets processed in the previous section, now I will just show screenshots of how it looks like with an injected malicious payload. Follow the same steps in the “Reproduce the vulnerability” section, but instead of sending the request through burpsuite. Send the request from the browser, so you can follow it in the debugger: The basic idea here is that you send the request with the project name edited and encoded. The server behind the solution decodes the payload, so now it’s just a normal Linux command. So, the basic structure of the command as we saw before is “script (dig.sh)” + “project name” + “folder”, and there’s where the injection happens in the project name, so the normal project name is now replaced with the payload. and this is what will be executed.

The root cause

I understood the root cause after the patch diffing. as it’s explained in the patch diffing, they replaced “project” with “projectName” and the reason is when you follow the debugger you will notice that “project” it’s just the name of the project name as it’s submitted (which is controlled by the user) after decoding. so when the attacker submits the malicious payload, the solution decodes it and passes it as it is a payload. The projectName it’s the real name with no characters or spaces. Once you follow
ProjectManager.getInstance(KylinConfig.getInstanceFromEnv())
You will notice the projectName variable value This is how it looks like after that

Patch Diffing

The fix link from here: https://github.com/apache/kylin/commit/f4daf14dde99b934c92ce2c832509f24342bc845#diff-5ca0e5634941e5810bc535c8084b3f11f9dce8cbb513500ec22db6a3a69ec930L97 As we can see the project variable was replaced with the projectName variable, and based on what we explained in the root cause of the vulnerable we understand that by replacing the project with projectName we eliminate the danger of the malicious payload injection.

Mitigation

Update Apache to the latest version.

Final Thoughts

This software was a real joy, the dependency between multiple solutions makes it a little bit harder to debug, but I tried my best to make it focus on Apache Kylin only. How the payload gets structured in order to be injected it’s really interesting and fun.

Resources:

About Version 2 Digital

Version 2 Digital is one of the most dynamic IT companies in Asia. The company distributes a wide range of IT products across various areas including cyber security, cloud, data protection, end points, infrastructures, system monitoring, storage, networking, business productivity and communication products.

Through an extensive network of channels, point of sales, resellers, and partnership companies, Version 2 offers quality products and services which are highly acclaimed in the market. Its customers cover a wide spectrum which include Global 1000 enterprises, regional listed companies, different vertical industries, public utilities, Government, a vast number of successful SMEs, and consumers in various Asian cities.

About VRX
VRX is a consolidated vulnerability management platform that protects assets in real time. Its rich, integrated features efficiently pinpoint and remediate the largest risks to your cyber infrastructure. Resolve the most pressing threats with efficient automation features and precise contextual analysis.

Stay Ahead of Cyber Threats with SafeDNS Statistics Feature

SafeDNS is an effective internet security solution that offers a variety of features to assist individuals and organizations in staying secure while online. Among the most useful functions is the statistics feature, which enables users to track and scrutinize their online activity in real-time. This article will examine the main advantages of SafeDNS statistics, and how it can assist in keeping your internet usage under control.

What Kind of Stats Do We Offer? 

SafeDNS statistics feature provides users with detailed insights into their internet activity, including information on blocked requests, blocked categories, blocked domains, and more. This information is presented in an easy-to-read format, allowing users to quickly identify potential threats and take appropriate action to protect themselves. 

Can We Export Them?

Yes, SafeDNS statistics can be easily exported to CSV format, making it easy to share this information with other stakeholders or analyze it in more detail using third-party software.

Are There Monthly Reports?

Yes, SafeDNS provides monthly reports that summarize internet activity for the previous month. These reports are customizable, allowing users to select the specific data points they want to include, and can be automatically generated and sent via email.

How Long Are Stats Archived For?

SafeDNS statistics are archived for up to 12 months, allowing users to track trends and identify patterns in their internet activity over an extended period.

What’s the Difference Between Detailed and General Stats?

SafeDNS provides two types of statistics: general and detailed. General statistics provide an overview of internet activity, including the number of requests, blocked requests, and blocked categories. Detailed statistics provide more granular information, including the specific domains and URLs that were blocked.

How Long Does it Take for the Stats to Update?

SafeDNS statistics are updated in real-time, within 5-7 minutes of internet activity. This implies that users can swiftly detect possible threats or suspicious actions and counteract or block them before they develop into a more significant concern.

In conclusion, the SafeDNS statistics feature is a valuable tool that provides users with insightful data about their internet activity. With the option to customize, archive, and export reports, this feature is useful for both individuals and organizations to enhance their online security and make informed decisions regarding their internet usage.

About Version 2 Digital

Version 2 Digital is one of the most dynamic IT companies in Asia. The company distributes a wide range of IT products across various areas including cyber security, cloud, data protection, end points, infrastructures, system monitoring, storage, networking, business productivity and communication products.

Through an extensive network of channels, point of sales, resellers, and partnership companies, Version 2 offers quality products and services which are highly acclaimed in the market. Its customers cover a wide spectrum which include Global 1000 enterprises, regional listed companies, different vertical industries, public utilities, Government, a vast number of successful SMEs, and consumers in various Asian cities.

About SafeDNS
SafeDNS breathes to make the internet safer for people all over the world with solutions ranging from AI & ML-powered web filtering, cybersecurity to threat intelligence. Moreover, we strive to create the next generation of safer and more affordable web filtering products. Endlessly working to improve our users’ online protection, SafeDNS has also launched an innovative system powered by continuous machine learning and user behavior analytics to detect botnets and malicious websites.

23.3.6 ‘Voyager’ released

Changes compared to 23.3.5

Enhancements

  • Enhancement: Significantly improve the performance of restoring files and folders from Disk Image Protected Items.
  • Enhancement: Support application credential authentication for OpenStack Swift storage.

Bug Fixes

  • Fix an issue with the My Devices widget no longer linking to filtered Users page results.
  • Fix an issue with generating codesigned Comet Backup for Windows client installers if Comet Server is also running on Windows.
  • Fix a cosmetic issue with not closing the job search dialog after clicking a button in the Comet Server web interface.
  • Fix an issue with slow job cancellation when using OpenStack Swift.

About Version 2 Digital

Version 2 Digital is one of the most dynamic IT companies in Asia. The company distributes a wide range of IT products across various areas including cyber security, cloud, data protection, end points, infrastructures, system monitoring, storage, networking, business productivity and communication products.

Through an extensive network of channels, point of sales, resellers, and partnership companies, Version 2 offers quality products and services which are highly acclaimed in the market. Its customers cover a wide spectrum which include Global 1000 enterprises, regional listed companies, different vertical industries, public utilities, Government, a vast number of successful SMEs, and consumers in various Asian cities.

About Comet
We are a team of dedicated professionals committed to developing reliable and secure backup solutions for MSP’s, Businesses and IT professionals. With over 10 years of experience in the industry, we understand the importance of having a reliable backup solution in place to protect your valuable data. That’s why we’ve developed a comprehensive suite of backup solutions that are easy to use, scalable and highly secure.

April 2023: What’s New?

“What’s New?” is a series of blog posts covering recent changes to Comet in more detail. This article covers the latest changes in Comet Voyager over April 2023.

There were five Comet software releases during April – four in the weekly 23.3.x Voyager release series, plus one minor patch update 23.2.2 for our quarterly “Leda” release track. We’ve also released a new YouTube tutorial for the new Object Lock feature

There were some very large and exciting features released in Voyager during April:

New design for the Comet Server web interface

When upgrading to Comet Server 23.3.3, you’ll be greeted with a new experience:

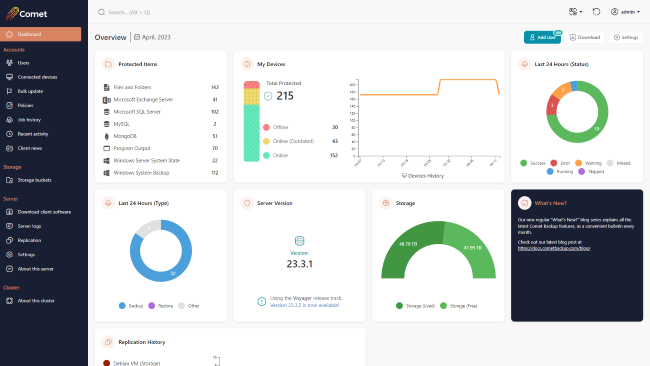
This is the first major Comet Server web interface upgrade in six years. We’re very excited and proud of the new layout. The left-aligned navigation bar allows for faster navigation to pages without clicking through menus, and the quick search bar has been modernized. The new design has also expanded the set of colour customization options that are available: in addition to setting your custom brand colour, you can also set an accent colour for highlights.

The homepage has seen the most dramatic change, including new navigation buttons on the top-right and a rework of all the admin widgets. There are new widgets showing how many of each Protected Item type is being used; how much used/free space there is on your Storage Role data location; the status and last run time of your Server Self-Backup; a live real-time chart of replication progress; and more.

The policies page has also been redesigned. As we add more and more policy options in new versions of Comet, we split the long Policy section to use sub-tabs. This includes a summary page, and a new feature to suggest possible common file path exclusions. We’re continuing to work on additional Policy features, and you can expect to see a highly-voted feature coming soon!

When looking at a user account, on the Protected Items tab, the new user interface design has also added a quick-access “Run Backup” button that can remotely command the device to start a backup job. Previously, this feature was available from the Connected Devices page or from the Devices tab – but adding it to the Protected Items tab is a significantly more convenient place, and demonstrates this functionality more clearly to new Comet administrators.

We would appreciate hearing your feedback on the new web interface design before it lands in the upcoming quarterly release!

Search restore from web

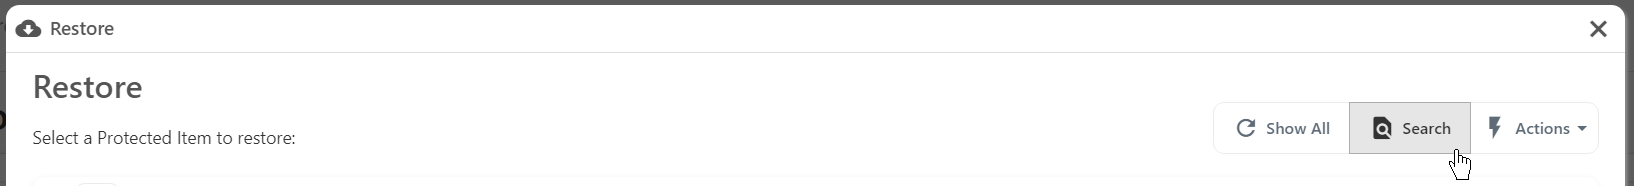
When restoring data, Comet prompts you for the Storage Vault to restore from; the backup snapshot to browse inside; and then the file (or all files), respectively. However if you’re trying to restore a single file without knowing exactly when it was last available, or what folder it was inside, Comet’s Search button can search through all backup job snapshots to find the right match.

The Search button has been available on the Restore dialog in the desktop app for a while. New in Comet 23.3.4 is the ability to remotely perform a file search for restore from the Comet Server web interface.

Test Connection for Storage Templates

Comet is highly flexible in the number of ways you can configure your storage. From the customer’s device running Comet Backup, a Storage Vault could point to a local path; directly at a cloud storage provider; or to your Comet Server with Storage Role enabled – which could then receive the data and store it on a local RAID array or forward it to another cloud storage provider.

Storage Templates are the provisioning system for new Storage Vaults. If you set up a Storage Template for Wasabi or Backblaze, you gain the ability to provision private, per-customer cloud buckets and access credentials with a single click. If you enable Storage Role for receiving data into your Comet Server (or another clustered Comet Server), using a Storage Template can help to very easily provision new Storage Role buckets for each customer.

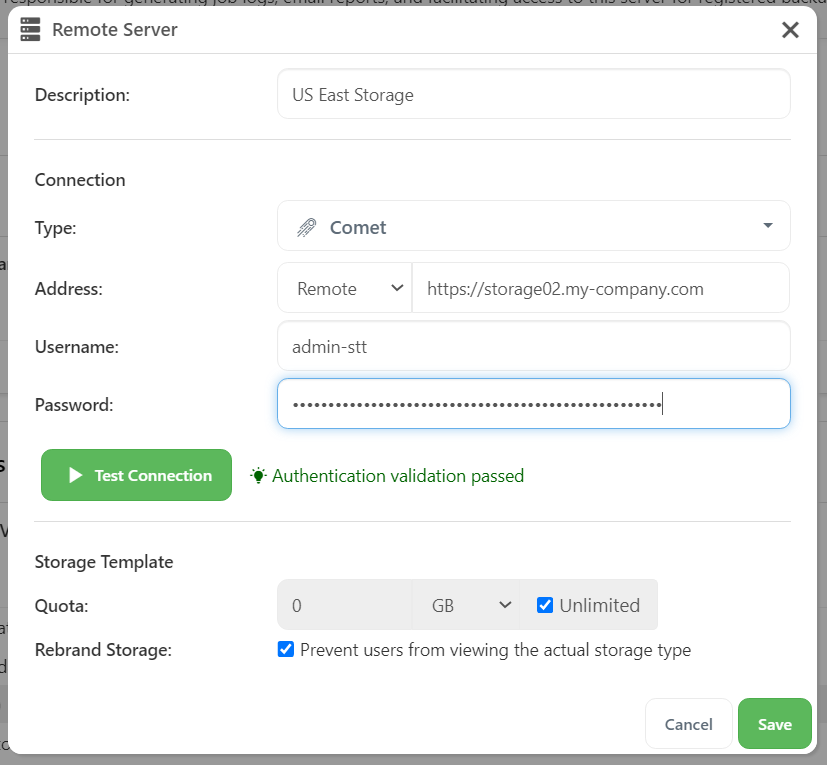
Comet has long supported a Test Connection button on the Storage Vault page, to check that your custom entered credentials are valid. But when setting up a Storage Template for the first time, the only way to verify that everything was functioning was to attempt to provision a new Storage Vault for a test customer.

In Comet 23.3.5, a new Test Connection button was added to the Storage Template configuration popup in the Comet Server web interface. This allows you to quickly verify that your template is working as expected.

Self-Backup

Comet Backup requires a connection to a Comet Server to safely store its configuration. But if you are self-hosting the Comet Server application, the Comet Server also should be backed up to mitigate against the risk of data loss. However, you can’t really use Comet Backup for this purpose, since this creates a circular dependency during recovery.

As a solution, Comet Server includes the Server Self-Backup feature. This creates a consistent snapshot of Comet’s configuration files, and allows you to store it encrypted on any supported storage location, including cloud storage. Multiple targets, custom scheduling, and data retention policies are all supported. The files are simple zip files to ensure that any eventual necessary restore is an easy and low-stress process.

The latest version of Comet Server made improvements to the Server Self-Backup feature. The generated filenames now clearly show the date and time of the backup job, instead of solely an epoch timestamp. Any automatic SSL certificate files provisioned by Let’s Encrypt are now included in the archive, ensuring that it is not required to reissue the certificate. This helps avoid any issues with rate limits on the Let’s Encrypt service, which could otherwise prolong your service outage.

We’ve also added a new option to include server log files in the Self-Backup archive. These log files are not generally required, but for completeness or for an investigation, they can provide an additional view into the circumstances behind the event.

Codesigned uninstallers

Microsoft, along with third-party security vendors, continue to harden the security posture of the Windows operating system. Comet Backup’s client installer is codesigned – either by our company, or if you are using custom branding, then possibly with your own custom codesigning certificate. However over time, the security hardening has increased, and we’ve recently heard reports that the uninstaller for Comet Backup could trigger alerts in some security products. As a result, the latest versions of Comet Server apply Authenticode codesigning to the uninstaller to help avoid this issue.

The 23.5 Quarterly release is coming soon

At Comet, we release our software under two tracks – the “Voyager” release track approximately weekly, with all of our very latest changes; and the quarterly release track, where we bundle up three months’ worth of development into a new fixed point for you to qualify, offer, and build upon, in order to provide a consistent experience for your own customers. Depending on your market position or your requirements, you may find either one of these tracks better suits your needs. As per our regular release schedule, you can expect a 23.5.0 quarterly release towards the end of this month, which will bring all of the exciting features to the quarterly track and also for Comet-Hosted users.

That’s all for this month! Thanks for reading – there are some more great features currently under development that we’re excited to be able to share with you soon. As always, please follow @CometBackup on Twitter and you can always contact us if you have any questions.

About Version 2 Digital

Version 2 Digital is one of the most dynamic IT companies in Asia. The company distributes a wide range of IT products across various areas including cyber security, cloud, data protection, end points, infrastructures, system monitoring, storage, networking, business productivity and communication products.

Through an extensive network of channels, point of sales, resellers, and partnership companies, Version 2 offers quality products and services which are highly acclaimed in the market. Its customers cover a wide spectrum which include Global 1000 enterprises, regional listed companies, different vertical industries, public utilities, Government, a vast number of successful SMEs, and consumers in various Asian cities.

About Comet
We are a team of dedicated professionals committed to developing reliable and secure backup solutions for MSP’s, Businesses and IT professionals. With over 10 years of experience in the industry, we understand the importance of having a reliable backup solution in place to protect your valuable data. That’s why we’ve developed a comprehensive suite of backup solutions that are easy to use, scalable and highly secure.

×

Hello!

Click one of our contacts below to chat on WhatsApp

×